
USA Stuffed Animals and Plush Toys Market Outlook to 2030
Region:North America
Author(s):Vijay Kumar
Product Code:KROD4405
December 2024
86
About the Report
USA Stuffed Animals and Plush Toys Market Overview
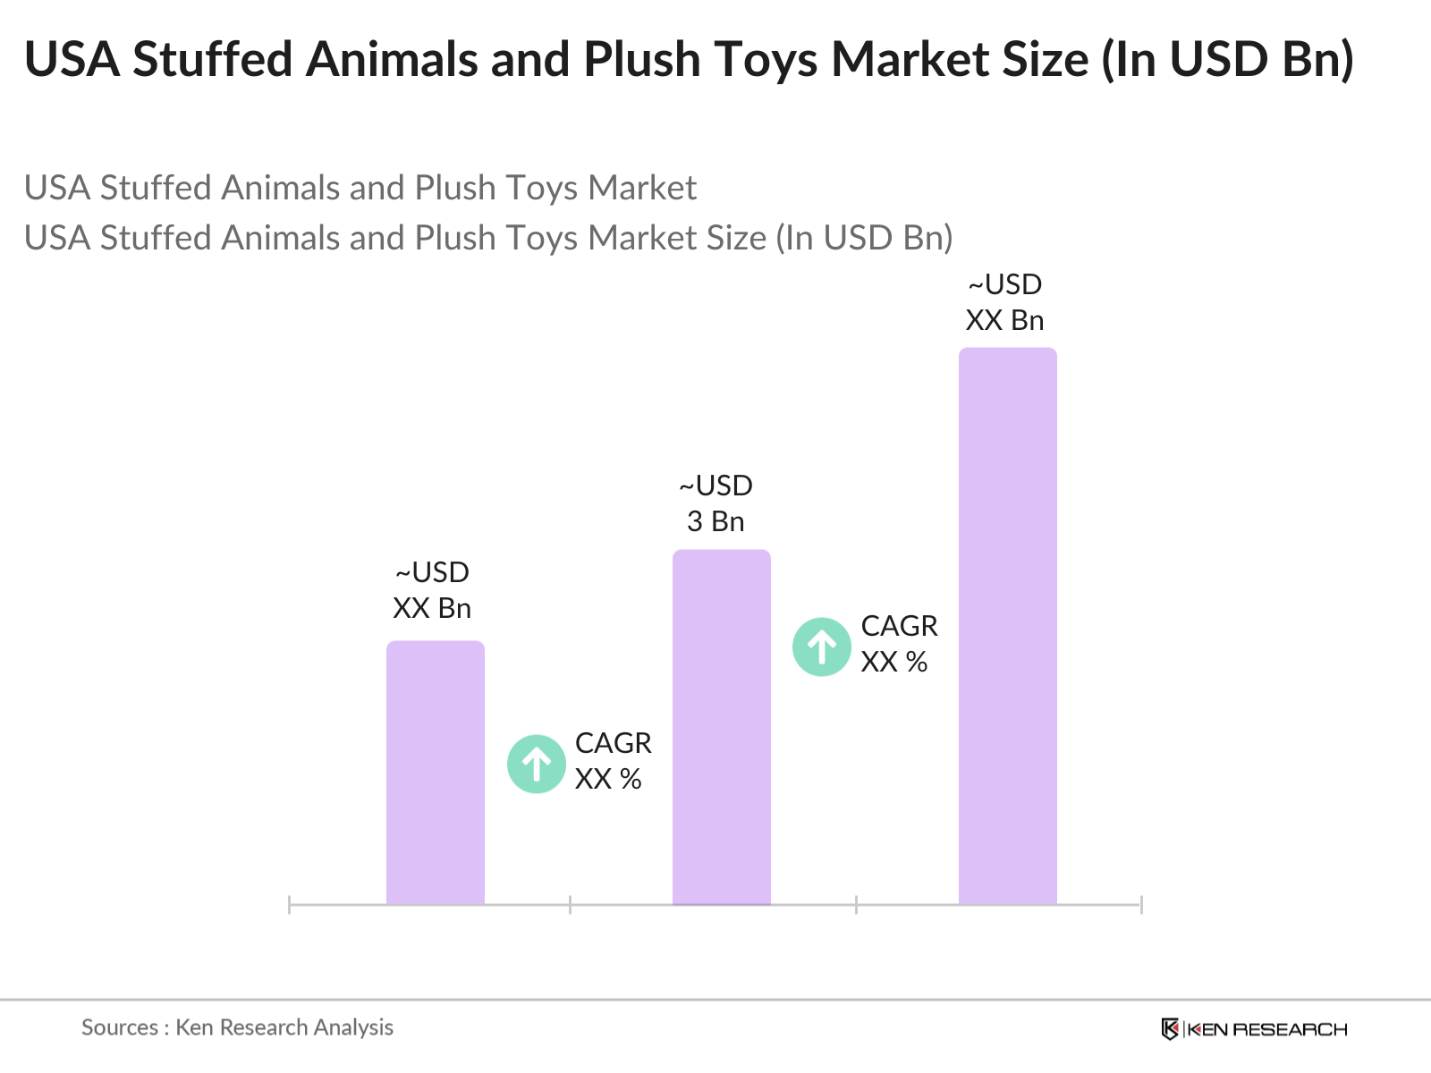
- The USA Stuffed Animals and Plush Toys market is valued at USD 3 billion, based on a five-year historical analysis. This market is primarily driven by an increasing consumer preference for sustainable and eco-friendly products, alongside the rising influence of licensed and character-based plush toys, such as those linked to popular movies and TV shows. Innovations in technology have also led to the growth of interactive and smart plush toys that appeal to tech-savvy parents and children alike, providing features such as voice activation and educational functionalities.
- In the USA, major cities such as New York, Los Angeles, and Chicago dominate the market due to their high population density, affluent consumer base, and large number of specialty stores and distribution centers. Additionally, these cities are home to many major toy fairs and expos, which promote innovation and product visibility. This regional dominance is also influenced by the presence of leading industry players headquartered in these areas, which boosts local production and distribution capabilities.
- The CPSCs regulations also address the flammability of materials and restrictions on the use of toxic substances, such as lead and phthalates, in toys. Any plush toy that fails to meet these requirements can be subject to recall, posing significant risks to manufacturers not adhering to these safety standards.
USA Stuffed Animals and Plush Toys Market Segmentation
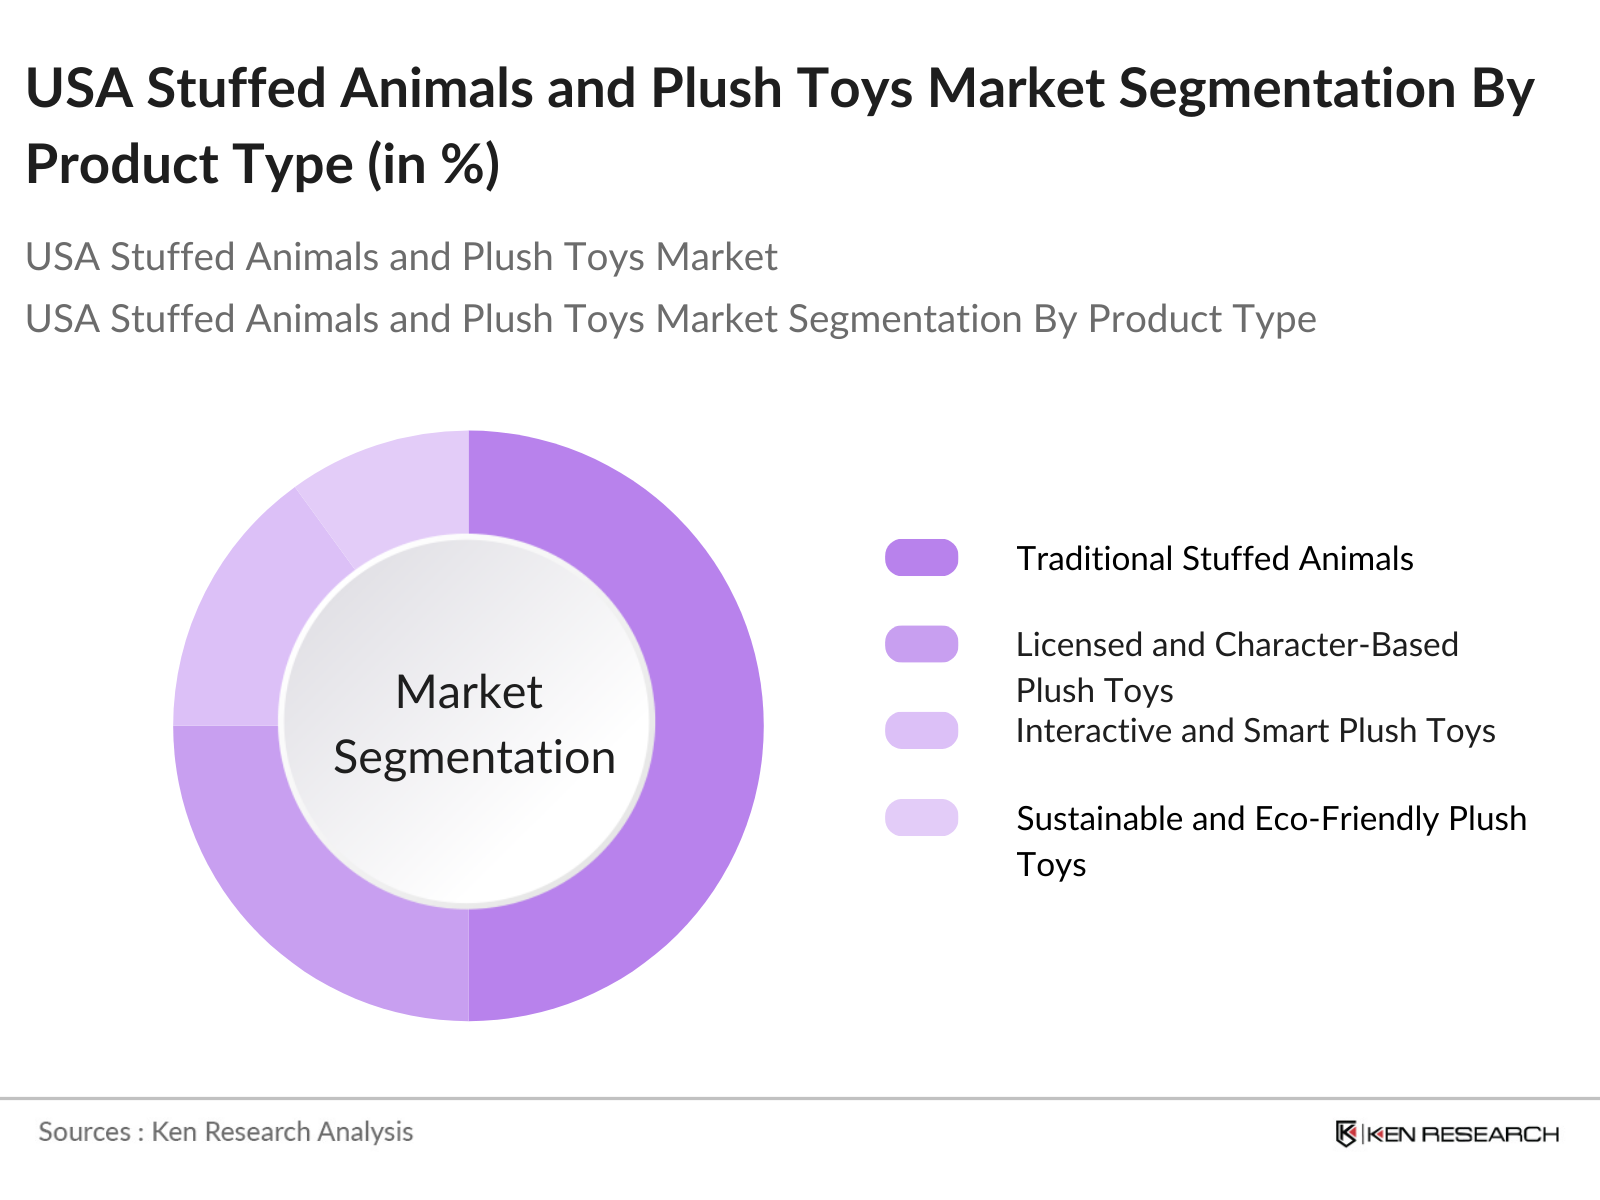
By Product Type: The market is segmented by product type into traditional stuffed animals, licensed and character-based plush toys, interactive and smart plush toys, sustainable and eco-friendly plush toys, and educational plush toys. Traditional stuffed animals hold a dominant market share under the segmentation by product type. Their popularity is driven by their enduring appeal and the sentimental value associated with these toys. Many parents prefer traditional stuffed animals for their perceived safety and simplicity.
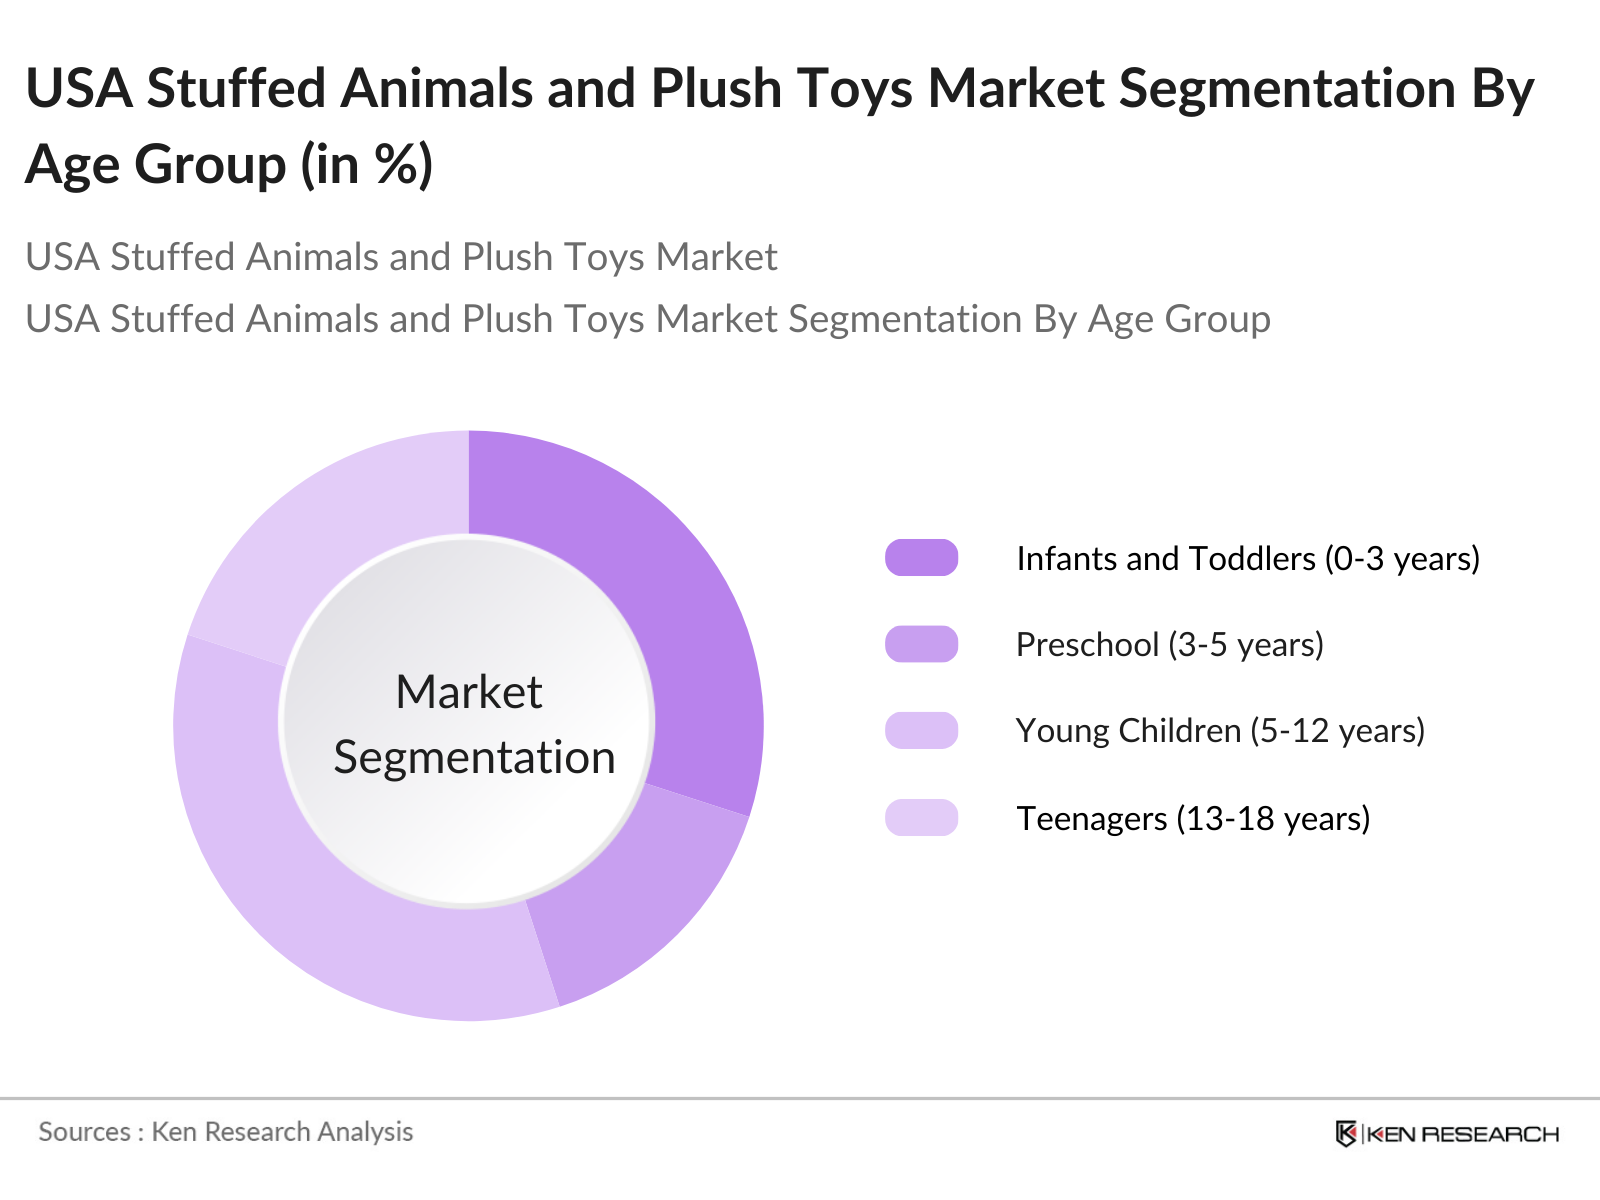
By Age Group: The market is also segmented by age group into infants and toddlers (0-3 years), preschool (3-5 years), young children (5-12 years), teenagers (13-18 years), and adult collectors and kidults. Young children (5-12 years) dominate the market share due to their high engagement with plush toys and preference for character-based and interactive products. Many products in this segment are tied to media properties such as movies and TV shows, which increases demand among this age group.
USA Stuffed Animals and Plush Toys Market Competitive Landscape
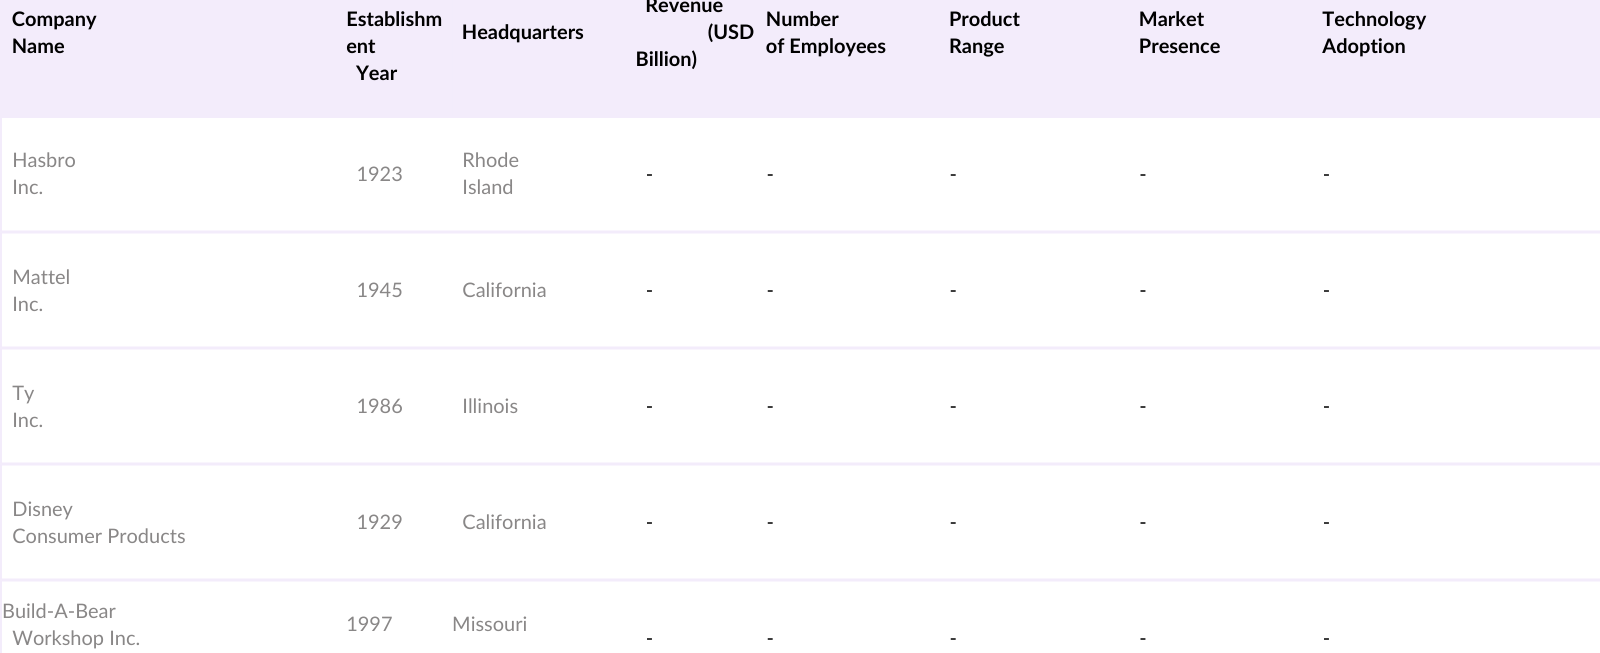
The USA stuffed animals and plush toys market is characterized by the presence of several key players who dominate the market through their extensive distribution networks, brand reputation, and continuous product innovation. Companies such as Hasbro, Mattel, and Disney Consumer Products have a significant presence due to their strong branding and association with popular licensed characters and media franchises.
USA Stuffed Animals and Plush Toys Industry Analysis
Growth Drivers
- Increased Consumer Demand for Sustainable Products: The demand for sustainable and eco-friendly plush toys has risen significantly in the U.S., driven by broader consumer interest in environmental responsibility. This trend aligns with the U.S. government's emphasis on promoting sustainable practices. According to the IMF, heightened awareness about climate change and sustainable development goals has led to the increased consumption of products made from organic and recycled materials, including plush toys. With environmental sustainability being a core focus, the market sees a growing preference for products that support these goals.
- Rise of E-commerce and Online Retail Channels: The e-commerce sector in the United States continues to expand, reaching $680.3 billion in service imports in 2022, up by $130.3 billion from 2021. This growth has enabled stuffed animals and plush toy manufacturers to leverage digital platforms for broader consumer reach. The popularity of e-commerce has also facilitated direct-to-consumer sales, boosting overall market accessibility and enabling smaller companies to compete with established brands.
- High Influence of Pop Culture and Licensed Characters: The influence of popular culture and media remains a critical growth driver in the plush toy market. The U.S. remains the largest global consumer of media, contributing to a high demand for licensed characters from movies, series, and games. The trade of licensed products is also influenced by trade policies and import standards, making licensed plush toys a highly regulated segment. This sector continues to thrive as new media franchises and characters enter the U.S. market.
Market Challenges
- Supply Chain Disruptions and Raw Material Costs: The U.S. plush toy market faces ongoing challenges due to disruptions in global supply chains. With trade tensions and restrictive import policies, the cost of raw materials has been volatile. According to the 2023 U.S. Trade Report, fluctuations in trade tariffs and customs regulations have added costs to imports of materials such as textiles and synthetic fibers, impacting the profitability of plush toy manufacturers.
- Rising Production Costs due to Eco-Friendly Materials: The shift towards sustainable materials has increased production costs in the plush toy industry. The use of organic cotton and recycled polyester, as required by environmental standards, comes at a premium price. This has led to increased retail prices for consumers, presenting a significant challenge for companies aiming to maintain competitive pricing while adhering to eco-friendly standards.
USA Stuffed Animals and Plush Toys Market Future Outlook
Over the next few years, the USA stuffed animals and plush toys market is expected to show significant growth driven by increasing consumer demand for sustainable products, innovative product offerings incorporating technology, and the continued popularity of licensed characters and franchises. The market is also likely to benefit from expanding distribution channels, particularly e-commerce, which provides accessibility to a broader consumer base.
Market Opportunities
- Integration of Technology into Plush Toys: There is a growing opportunity to integrate technology into plush toys, making them interactive and appealing to tech-savvy consumers. With the U.S. being one of the largest technology adopters, plush toys with embedded sensors, AI capabilities, or connectivity features are gaining traction. This integration offers potential for new revenue streams and market expansion, especially in the educational and therapeutic toy segments.
- Expansion into Educational and Therapeutic Toys: The expansion of plush toys into the educational and therapeutic toy market presents significant opportunities. The U.S. market has seen increased demand for products that serve a dual purposeentertainment and education. Plush toys designed for therapeutic use in occupational therapy, autism support, and sensory development are in high demand, reflecting an evolving consumer preference for products with added value.
Scope of the Report
|
Product Type |
Traditional Stuffed Animals Licensed and Character-Based Plush Toys Interactive and Smart Plush Toys Sustainable and Eco-Friendly Plush Toys Educational Plush Toys |
|
Age Group |
Infants and Toddlers (0-3 years) Preschool (3-5 years) Young Children (5-12 years) Teenagers (13-18 years) Adult Collectors and Kidults |
|
Distribution Channel |
Specialty Stores Online Retail Hypermarkets and Supermarkets Department Stores Toy and Gift Stores |
|
Price Range |
Economy Mid-Range Premium |
|
Region |
Northeast Midwest South West |
Products
Key Target Audience
Toy Manufacturers and Distributors
E-commerce Platforms and Retailers
Investment and Venture Capitalist Firms
Specialty Toy Stores
Department Stores
Government and Regulatory Bodies (U.S. Consumer Product Safety Commission)
Childrens Healthcare and Educational Institutions
Sustainability and Environmental NGOs
Companies
Players Mentioned in the Report
Hasbro Inc.
Mattel Inc.
Ty Inc.
GUND
Funko Inc.
Spin Master Corp.
Build-A-Bear Workshop Inc.
Wild Republic
Squishmallows
Aurora World
Table of Contents
1. USA Stuffed Animals and Plush Toys Market Overview
1.1. Definition and Scope
1.2. Market Taxonomy
1.3. Market Growth Rate
1.4. Market Segmentation Overview
2. USA Stuffed Animals and Plush Toys Market Size (in USD Bn)
2.1. Historical Market Size
2.2. Year-On-Year Growth Analysis
2.3. Key Market Developments and Milestones
2.4. Market Revenue Analysis
3. USA Stuffed Animals and Plush Toys Market Analysis
3.1. Growth Drivers
3.1.1. Increased Consumer Demand for Sustainable Products
3.1.2. Rise of E-commerce and Online Retail Channels
3.1.3. High Influence of Pop Culture and Licensed Characters
3.2. Market Challenges
3.2.1. Supply Chain Disruptions and Raw Material Costs
3.2.2. Rising Production Costs due to Eco-Friendly Materials
3.2.3. Counterfeit Products and Regulatory Compliance
3.3. Opportunities
3.3.1. Integration of Technology into Plush Toys
3.3.2. Expansion into Educational and Therapeutic Toys
3.3.3. Growth of Kidult Segment and Collectibles
3.4. Trends
3.4.1. Growth of Sustainable and Eco-Friendly Plush Toys
3.4.2. Digital and Interactive Plush Toy Innovations
3.4.3. Customization and Personalization of Plush Toys
3.5. Government Regulation
3.5.1. U.S. Consumer Product Safety Commission Standards
3.5.2. Regulations on Flammability and Toxic Materials
3.5.3. Import Tariffs and Trade Policies
3.6. SWOT Analysis
3.7. Stakeholder Ecosystem
3.8. Porters Five Forces
3.9. Competition Ecosystem
4. USA Stuffed Animals and Plush Toys Market Segmentation
4.1. By Product Type (in Value %)
4.1.1. Traditional Stuffed Animals
4.1.2. Licensed and Character-Based Plush Toys
4.1.3. Interactive and Smart Plush Toys
4.1.4. Sustainable and Eco-Friendly Plush Toys
4.1.5. Educational Plush Toys
4.2. By Age Group (in Value %)
4.2.1. Infants and Toddlers (0-3 years)
4.2.2. Preschool (3-5 years)
4.2.3. Young Children (5-12 years)
4.2.4. Teenagers (13-18 years)
4.2.5. Adult Collectors and Kidults
4.3. By Distribution Channel (in Value %)
4.3.1. Specialty Stores
4.3.2. Online Retail
4.3.3. Hypermarkets and Supermarkets
4.3.4. Department Stores
4.3.5. Toy and Gift Stores
4.4. By Price Range (in Value %)
4.4.1. Economy
4.4.2. Mid-Range
4.4.3. Premium
4.5. By Region (in Value %)
4.5.1. Northeast
4.5.2. Midwest
4.5.3. South
4.5.4. West
5. USA Stuffed Animals and Plush Toys Market Competitive Analysis
5.1. Detailed Profiles of Major Companies
5.1.1. Hasbro Inc.
5.1.2. Mattel Inc.
5.1.3. Ty Inc.
5.1.4. GUND
5.1.5. Funko, Inc.
5.1.6. Spin Master Corp.
5.1.7. Build-A-Bear Workshop, Inc.
5.1.8. Wild Republic
5.1.9. Squishmallows
5.1.10. Aurora World
5.1.11. Disney Consumer Products
5.1.12. Jellycat Ltd.
5.1.13. Vermont Teddy Bear Company
5.1.14. Fiesta Toys
5.1.15. Mary Meyer Corporation
5.2. Cross Comparison Parameters
(No. of Employees, Headquarters, Revenue, Inception Year, Market Share, Product Categories, Technological Adoption, Sustainability Initiatives)
5.3. Market Share Analysis
5.4. Strategic Initiatives
5.5. Mergers and Acquisitions
5.6. Investment Analysis
5.7. Venture Capital Funding
5.8. Government Grants
5.9. Private Equity Investments
6. USA Stuffed Animals and Plush Toys Market Regulatory Framework
6.1. Environmental Standards
6.2. Compliance Requirements
6.3. Certification Processes
7. USA Stuffed Animals and Plush Toys Future Market Size (in USD Bn)
7.1. Future Market Size Projections
7.2. Key Factors Driving Future Market Growth
8. USA Stuffed Animals and Plush Toys Future Market Segmentation
8.1. By Product Type (in Value %)
8.2. By Age Group (in Value %)
8.3. By Distribution Channel (in Value %)
8.4. By Price Range (in Value %)
8.5. By Region (in Value %)
9. USA Stuffed Animals and Plush Toys Market Analysts Recommendations
9.1. TAM/SAM/SOM Analysis
9.2. Customer Cohort Analysis
9.3. Marketing Initiatives
9.4. White Space Opportunity Analysis
Disclaimer Contact UsResearch Methodology
Step 1: Identification of Key Variables
The initial phase involves constructing an ecosystem map encompassing all major stakeholders within the USA stuffed animals and plush toys market. This step is underpinned by extensive desk research, utilizing a combination of secondary and proprietary databases to gather comprehensive industry-level information. The primary objective is to identify and define the critical variables that influence market dynamics.
Step 2: Market Analysis and Construction
In this phase, historical data is compiled and analyzed, including assessing market penetration and revenue generation. Additionally, an evaluation of production capacity, sales performance, and consumer preferences is conducted to ensure the reliability and accuracy of the revenue estimates.
Step 3: Hypothesis Validation and Expert Consultation
Market hypotheses are developed and subsequently validated through computer-assisted telephone interviews (CATIs) with industry experts representing a diverse array of companies. These consultations provide valuable operational and financial insights directly from industry practitioners, which are instrumental in refining and corroborating the market data.
Step 4: Research Synthesis and Final Output
The final phase involves direct engagement with multiple plush toy manufacturers to acquire detailed insights into product segments, sales performance, consumer preferences, and other pertinent factors. This interaction serves to verify and complement the statistics derived from the bottom-up approach, ensuring a comprehensive, accurate, and validated analysis of the USA stuffed animals and plush toys market.
Frequently Asked Questions
01. How big is the USA Stuffed Animals and Plush Toys Market?
The USA Stuffed Animals and Plush Toys market is valued at USD 3 billion, based on a five-year historical analysis. This market is primarily driven by an increasing consumer preference for sustainable and eco-friendly products, alongside the rising influence of licensed and character-based plush toys, such as those linked to popular movies and TV shows.
02. What are the challenges in the USA Stuffed Animals and Plush Toys Market?
Challenges include rising production costs due to eco-friendly materials, counterfeit products affecting brand integrity, and fluctuating consumer demand influenced by pop culture trends.
03. Who are the major players in the USA Stuffed Animals and Plush Toys Market?
Major players include Hasbro Inc., Mattel Inc., Ty Inc., Disney Consumer Products, and Build-A-Bear Workshop Inc., all known for their extensive distribution networks and brand presence.
04. What are the growth drivers of the USA Stuffed Animals and Plush Toys Market?
The market is propelled by increasing consumer demand for sustainable products, growth in online retail channels, and the influence of popular media properties such as movies and TV shows.
Why Buy From Us?
 Framework")
What makes us stand out is that our consultants follows Robust, Refine and Result (RRR) methodology. i.e. Robust for clear definitions, approaches and sanity checking, Refine for differentiating respondents facts and opinions and Result for presenting data with story

We have set a benchmark in the industry by offering our clients with syndicated and customized market research reports featuring coverage of entire market as well as meticulous research and analyst insights.

While we don't replace traditional research, we flip the method upside down. Our dual approach of Top Bottom & Bottom Top ensures quality deliverable by not just verifying company fundamentals but also looking at the sector and macroeconomic factors.

With one step in the future, our research team constantly tries to show you the bigger picture. We help with some of the tough questions you may encounter along the way: How is the industry positioned? Best marketing channel? KPI's of competitors? By aligning every element, we help maximize success.

Our report gives you instant access to the answers and sources that other companies might choose to hide. We elaborate each steps of research methodology we have used and showcase you the sample size to earn your trust.

If you need any support, we are here! We pride ourselves on universe strength, data quality, and quick, friendly, and professional service.