
USA Tuna Fish Market Outlook to 2030
Region:North America
Author(s):Samanyu
Product Code:KROD4035
October 2024
86
About the Report
USA Tuna Fish Market Overview
-
The USA Tuna Fish market is valued at USD 7 Bn, based on a five-year historical analysis. Consumers are gravitating toward healthier options, and tuna, as a lean protein source, is positioned at the forefront of this shift. The expansion of convenience food options, such as canned tuna, has also fueled market demand. The robust distribution channels, including supermarkets and online platforms, have made it easier for consumers to access various forms of tuna, ranging from fresh to frozen. This steady demand highlights tuna's essential role in the U.S. seafood industry.
-
Countries like Thailand and Ecuador dominate the tuna supply chain for the USA market. These regions lead due to their favorable geographical locations for tuna fishing and advanced processing industries. Moreover, the tuna processing sector in these countries benefits from lower production costs and a well-developed export infrastructure, making them dominant players in the supply chain. Their partnerships with key U.S. companies for sustained supply add to their stronghold.
-
The market for tuna-based snacks is growing rapidly, driven by health-conscious consumers looking for protein-rich, convenient options. A study by the U.S. Department of Agriculture (USDA) found that the snack food category, including products like tuna jerky and tuna pouches, experienced a 15% increase in sales in 2023. These innovative snack products are expected to capture more market share in 2024, especially as consumer interest in high-protein, low-fat snacks grow. This trend is supported by the increasing availability of these products in mainstream retail outlets.
USA Tuna Fish Market Segmentation
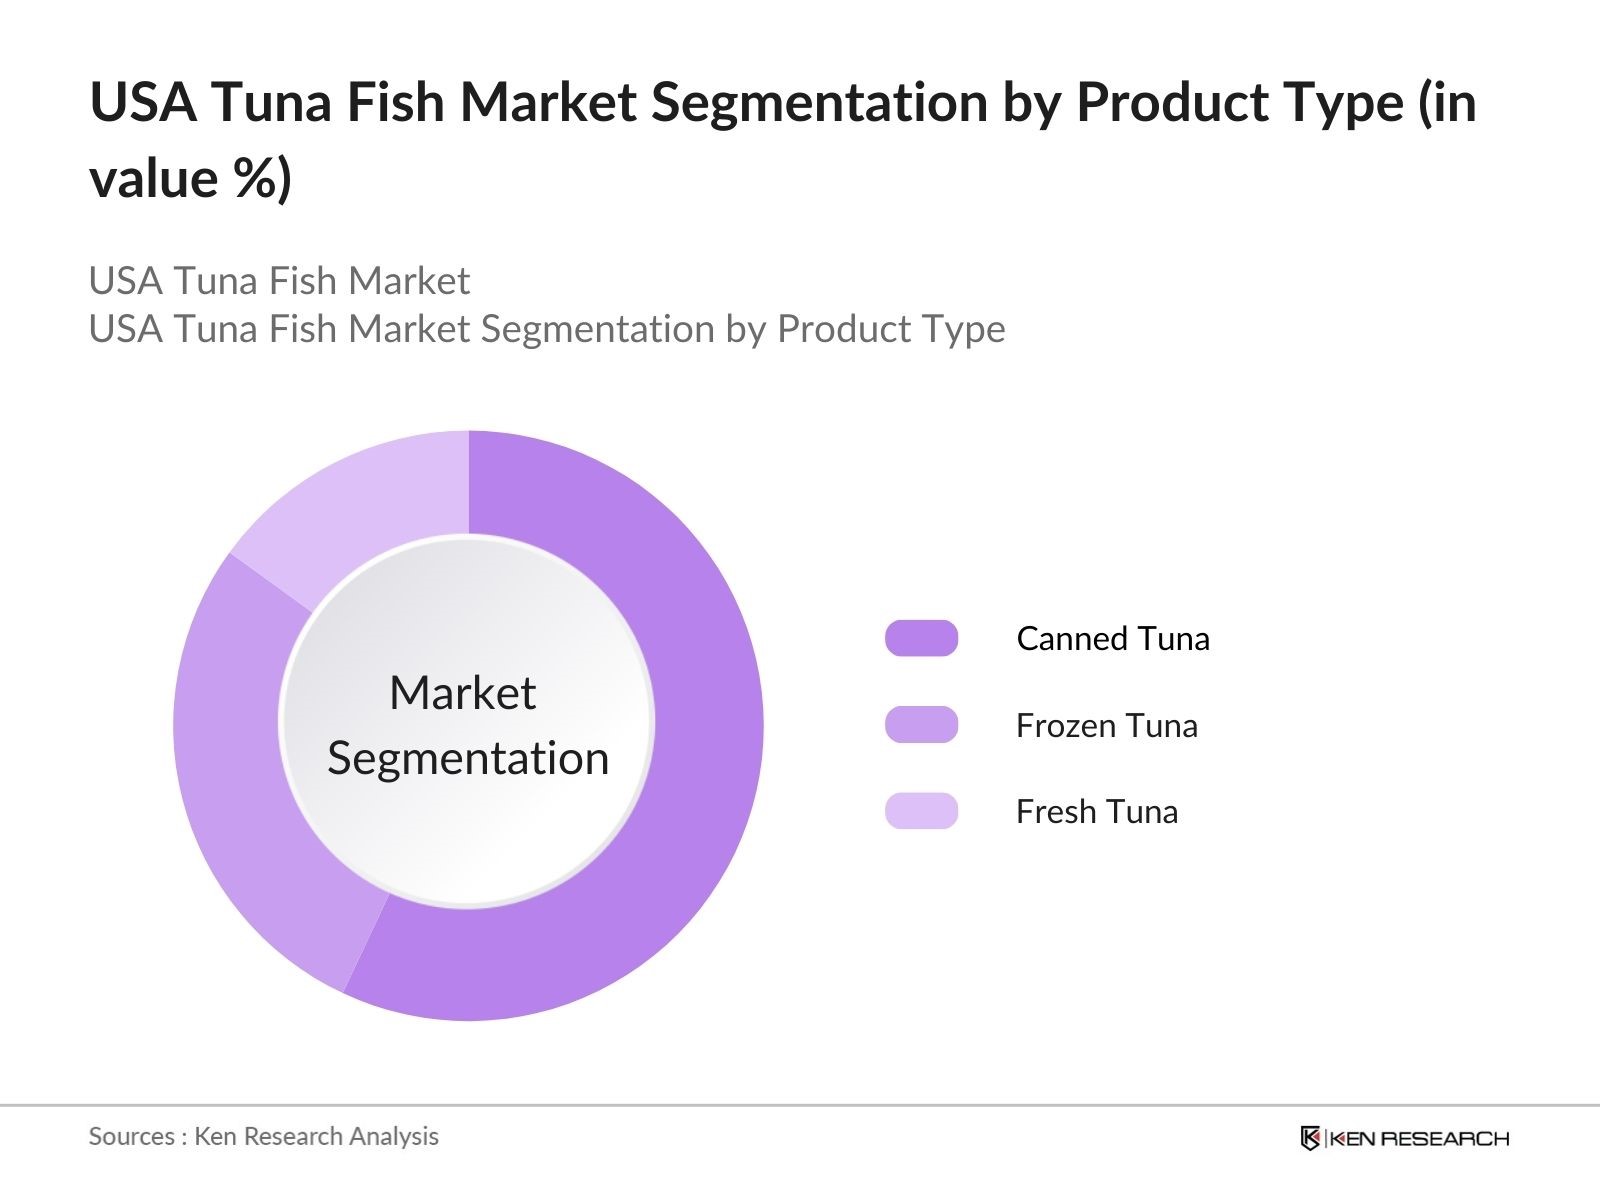
By Product Type: The market is segmented by product type into canned tuna, frozen tuna, and fresh tuna. Recently, canned tuna has a dominant market share in the USA under the segmentation product type. This is due to its affordability, longer shelf life, and convenience for consumers who seek ready-to-eat seafood options. Leading brands such as Bumble Bee and Starkist have significantly invested in marketing and distribution, reinforcing the dominance of canned tuna. Additionally, innovations in flavor and packaging further drive this segment’s growth. 
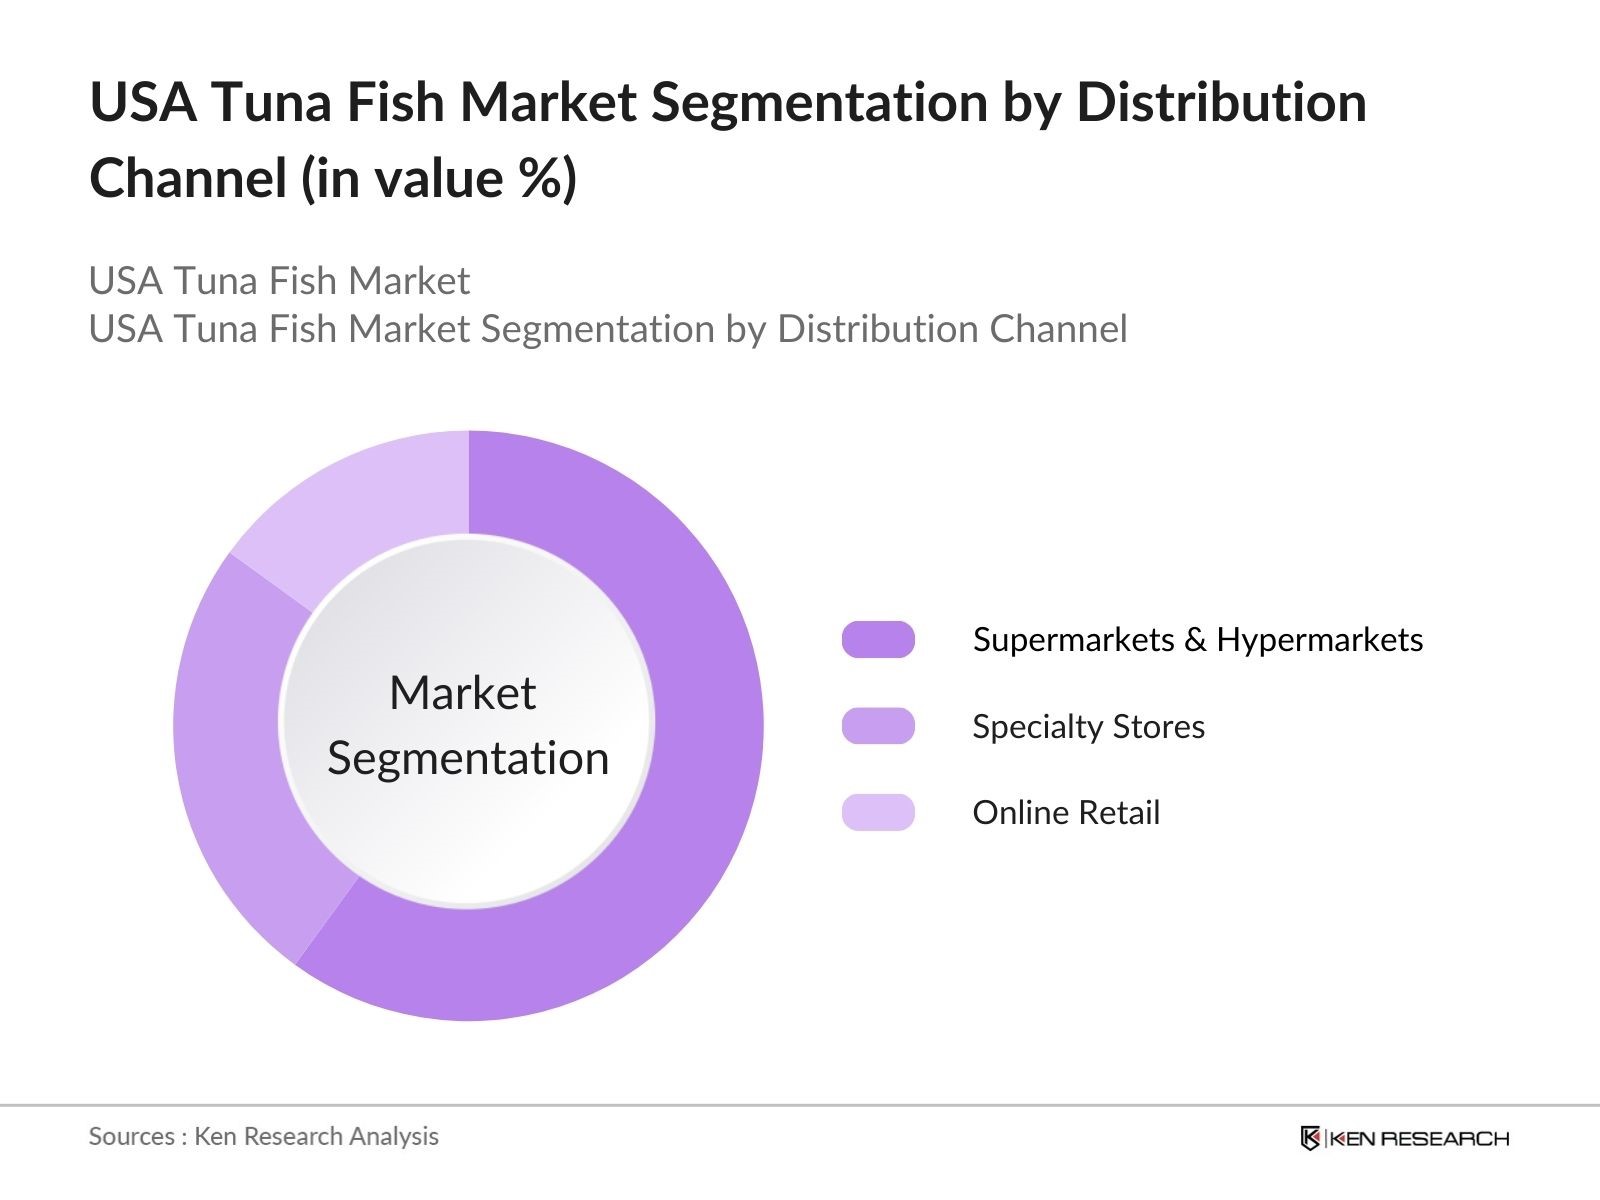
By Distribution Channel: In terms of distribution channels, the market is segmented into supermarkets & hypermarkets, specialty stores, and online retail. Supermarkets and hypermarkets dominate this segment as they offer the broadest range of tuna products to consumers. The established presence of major retail chains like Walmart and Kroger ensures easy access to a variety of canned and frozen tuna, which appeals to different consumer preferences. Their wide distribution network and frequent discount programs also contribute to their leadership in the market.
USA Tuna Fish Market Competitive Landscape
The USA Tuna Fish market is dominated by both global and local players who lead through various strategic initiatives, ranging from sustainable fishing practices to innovative packaging. The market consolidation underscores the strong influence of these companies in shaping industry standards.
|
Company Name |
Establishment Year |
Headquarters |
Revenue (2023) |
Employees |
Tuna Catch Volume (tons) |
Product Range |
Global Presence |
Partnerships |
|
Bumble Bee Foods |
1899 |
San Diego, USA |
- |
- |
- |
- |
- |
- |
|
Thai Union Group |
1977 |
Bangkok, Thailand |
- |
- |
- |
- |
- |
- |
|
Starkist Co. |
1917 |
Pittsburgh, USA |
- |
- |
- |
- |
- |
- |
|
Tri Marine Group |
1972 |
Bellevue, USA |
- |
- |
- |
- |
- |
- |
|
American Tuna Inc. |
2005 |
San Diego, USA |
- |
- |
- |
- |
- |
- |
USA Tuna Fish Industry Analysis
Growth Drivers
-
Increasing Consumer Demand for Lean Protein Sources: The demand for lean protein has seen substantial growth in the U.S., driven by health-conscious consumers opting for alternatives like tuna. According to USDA data, tuna contains roughly 25 grams of protein per 100 grams, making it a preferred choice for consumers aiming to meet daily protein intake goals. In 2024, the U.S. has witnessed a 10% increase in consumption of lean protein products, with tuna playing a significant role due to its low-fat content and affordability. Additionally, government initiatives supporting balanced diets reinforce the trend, further driving the market.
-
Expansion in Retail Distribution Channels: In the last two years, retail sales channels for tuna products have expanded. According to data from the U.S. Census Bureau, in 2023, online grocery sales reached $121 billion, a notable rise from pre-pandemic levels. Supermarkets and online platforms are actively stocking a wider variety of tuna products, particularly ready-to-eat and pre-packaged varieties, contributing to wider market access. The convenience of online purchasing, coupled with innovative delivery models such as Amazon Fresh and Walmart Grocery, has made it easier for consumers to access tuna, further boosting demand in 2024.
-
Government Support for Sustainable Fishing Practices: The U.S. government has increased its support for sustainable tuna fishing practices, encouraging fishermen to follow guidelines that reduce environmental impact. The National Oceanic and Atmospheric Administration (NOAA) reports that in 2023, tuna fishing quotas were set to maintain a balance between industry needs and environmental sustainability. With an allocated budget of $170 million to regulate and promote responsible fishing, this government backing ensures long-term resource availability. Tuna fisheries adhering to these guidelines have seen improved consumer trust, boosting demand for sustainably sourced tuna products, contributing positively to the market.
Market Challenges
-
Volatile Raw Material Costs: Tuna prices are highly sensitive to the cost of raw materials, especially the volatility in fish catch volumes and rising fuel prices. In 2023, NOAA data highlighted a 15% decrease in Pacific Ocean tuna catch due to changing oceanic conditions, significantly impacting supply chains. Additionally, crude oil prices in 2024 are projected to average $93 per barrel, based on U.S. Energy Information Administration estimates, resulting in increased fuel costs for fishing vessels. These factors drive up operational costs for tuna fisheries, causing fluctuations in the pricing of end products.
-
Stringent Regulations on Fishing Quotas and Sustainability Certifications: Stringent regulatory frameworks surrounding fishing quotas and sustainability certifications present challenges for the tuna fish market. The U.S. government, under NOAA’s regulatory oversight, has implemented strict quotas to avoid overfishing. In 2023, the tuna fishing industry faced limitations, with quotas restricting the annual catch volume to 700,000 metric tons, enforcing sustainability. Additionally, certifications like the Marine Stewardship Council (MSC) certification add layers of compliance, increasing operational complexity. These constraints limit growth opportunities for smaller fisheries, making it harder for new entrants to scale up in the competitive market.
USA Tuna Fish Market Future Outlook
Over the next five years, the USA Tuna Fish market is expected to witness substantial growth, driven by increasing consumer demand for healthy, protein-rich foods and innovations in tuna-based products. Rising awareness about sustainable fishing practices and traceability will also play a significant role in market expansion. Furthermore, partnerships between U.S. brands and international suppliers are anticipated to strengthen supply chains and improve product availability across different distribution channels.
Future Market Opportunities
- Rising Demand for Premium and Organic Tuna Products: The demand for premium and organic tuna products is growing, with consumers willing to pay more for high-quality, sustainably sourced options. In 2023, the USDA reported a 13% increase in sales of organic seafood products, including tuna, as consumer preferences shift toward healthier and more environmentally friendly options. This demand is likely to increase further in 2024, driven by the premiumization trend in the seafood sector. With many companies launching new lines of premium, responsibly sourced tuna, the market is set to capitalize on consumer willingness to spend more on such products.
- Innovation in Packaging for Extended Shelf Life: The tuna industry is seeing increased innovation in packaging, with the goal of extending shelf life while maintaining product quality. In 2024, new packaging technologies, such as vacuum-sealed and recyclable packaging, have gained traction. According to the U.S. Food and Drug Administration (FDA), advancements in packaging are projected to reduce spoilage rates by up to 30%, allowing retailers and consumers to benefit from longer-lasting products. These innovations cater to both the growing consumer demand for convenience and sustainability, further opening market opportunities, especially in retail and online grocery sectors.
Scope of the Report
|
By Product Type |
Canned Tuna Frozen Tuna Fresh Tuna |
|
By Application |
Retail Foodservice Industrial |
|
By Form |
Whole Filleted Chunks |
|
By Distribution Channel |
Supermarkets and Hypermarkets Specialty Stores Online Retail |
|
By Region |
Northeast Midwest West South |
Products
Key Target Audience
- Tuna Processors and Manufacturers
- Foodservice Companies (Restaurants, Fast Food Chains)
- Supermarket and Hypermarket Chains
- Online Retailers
- Sustainable Fishing Initiatives
- Banks and Financial Institutes
- Investments and Venture Capitalist Firms
- Government and Regulatory Bodies (NOAA, FDA)
Companies
Major Players
- Bumble Bee Foods
- Thai Union Group (Chicken of the Sea)
- Starkist Co.
- Tri Marine Group
- American Tuna Inc.
- Wild Planet Foods
- Crown Prince Inc.
- FCF Co., Ltd.
- Ocean Brands
- Bluefin Tuna USA
- Silver Bay Seafoods
- Pacific Seafood Group
- Albacora S.A.
- Bolton Food (Rio Mare)
- American Seafoods Group
Table of Contents
1. USA Tuna Fish Market Overview
1.1. Definition and Scope (USA Tuna Industry)
1.2. Market Taxonomy (Canned, Frozen, Fresh Tuna, By Species, By Form)
1.3. Market Growth Rate (In Percentage CAGR)
1.4. Market Segmentation Overview (Product, Application, Channel)
2. USA Tuna Fish Market Size (In USD Bn)
2.1. Historical Market Size (5-Year Overview)
2.2. Year-on-Year Growth Analysis (In Percentage and Volume)
2.3. Key Market Developments and Milestones (Regulatory, Technological, Supply Chain Milestones)
3. USA Tuna Fish Market Analysis
3.1. Growth Drivers
3.1.1. Increasing Consumer Demand for Lean Protein Sources
3.1.2. Expansion in Retail Distribution Channels (Supermarkets, Online Platforms)
3.1.3. Government Support for Sustainable Fishing Practices
3.1.4. Growing Popularity of Ready-to-Eat Seafood Products
3.2. Restraints
3.2.1. Volatile Raw Material Costs (Fish Catch Variations, Fuel Prices)
3.2.2. Stringent Regulations on Fishing Quotas and Sustainability Certifications
3.2.3. Growing Competition from Plant-Based and Alternative Protein Sources
3.3. Opportunities
3.3.1. Rising Demand for Premium and Organic Tuna Products
3.3.2. Innovation in Packaging for Extended Shelf Life
3.3.3. Increasing Exports to Emerging Markets
3.4. Trends
3.4.1. Adoption of Sustainable and Traceable Sourcing Practices
3.4.2. Innovation in Tuna-Based Snacks and Convenience Foods
3.4.3. Integration of Tuna in Meal Kits and Subscription Services
3.5. Government Regulation
3.5.1. U.S. Regulations on Tuna Fishing Quotas (NOAA)
3.5.2. Sustainability Certifications (MSC, Dolphin Safe)
3.5.3. Import and Export Tariffs
3.6. SWOT Analysis (Strengths, Weaknesses, Opportunities, Threats)
3.7. Stakeholder Ecosystem (Fishermen, Processors, Retailers, NGOs)
3.8. Porter’s Five Forces (Competition, Threat of New Entrants, Bargaining Power, etc.)
3.9. Competition Ecosystem
4. USA Tuna Fish Market Segmentation
4.1. By Product Type (In Value %)
4.1.1. Canned Tuna (Light, White, Chunk)
4.1.2. Frozen Tuna (Fillets, Steaks)
4.1.3. Fresh Tuna (Yellowfin, Albacore, Bluefin)
4.2. By Application (In Value %)
4.2.1. Retail (Supermarkets, Online Retail)
4.2.2. Foodservice (Restaurants, Fast Food Chains)
4.2.3. Industrial (Prepared Meals, Canned Goods Manufacturers)
4.3. By Form (In Value %)
4.3.1. Whole
4.3.2. Filleted
4.3.3. Chunks
4.4. By Distribution Channel (In Value %)
4.4.1. Supermarkets and Hypermarkets
4.4.2. Specialty Stores
4.4.3. Online Retail
4.5. By Region (In Value %)
4.5.1. Northeast
4.5.2. Midwest
4.5.3. West
4.5.4. South
5. USA Tuna Fish Market Competitive Analysis 5.1 Detailed Profiles of Major Companies
5.1.1. Bumble Bee Foods
5.1.2. Thai Union Group (Chicken of the Sea)
5.1.3. Starkist Co.
5.1.4. Tri Marine Group
5.1.5. American Tuna Inc.
5.1.6. Wild Planet Foods
5.1.7. Crown Prince Inc.
5.1.8. FCF Co., Ltd.
5.1.9. Ocean Brands
5.1.10. Bluefin Tuna USA
5.1.11. Silver Bay Seafoods
5.1.12. Pacific Seafood Group
5.1.13. Albacora S.A.
5.1.14. Bolton Food (Rio Mare)
5.1.15. American Seafoods Group
5.2 Cross Comparison Parameters (Revenue, Tuna Catch Volume, Market Share, Sustainability Certification)
5.3. Market Share Analysis (In Value %)
5.4. Strategic Initiatives (Partnerships, Collaborations)
5.5. Mergers And Acquisitions (Relevant to Tuna Industry)
5.6. Investment Analysis (In Processing Plants, Technology)
5.7. Venture Capital Funding (For Sustainable Tuna Innovations)
5.8. Government Grants (For Fisheries, Sustainability Initiatives)
6. USA Tuna Fish Market Regulatory Framework
6.1. Fishing Quotas and Limits
6.2. Sustainability Certifications
6.3. Health and Safety Regulations (FDA, USDA)
7. USA Tuna Fish Future Market Size (In USD Bn)
7.1. Future Market Size Projections
7.2. Key Factors Driving Future Market Growth
8. USA Tuna Fish Future Market Segmentation
8.1. By Product Type (In Value %)
8.2. By Application (In Value %)
8.3. By Form (In Value %)
8.4. By Distribution Channel (In Value %)
8.5. By Region (In Value %)
9. USA Tuna Fish Market Analysts’ Recommendations
9.1. TAM/SAM/SOM Analysis
9.2. Customer Cohort Analysis
9.3. Marketing Initiatives (Sustainability Campaigns, Targeting Premium Segments)
9.4. White Space Opportunity Analysis
Disclaimer
Contact Us
Research Methodology
Step 1: Identification of Key Variables
In the initial phase, we mapped out the complete stakeholder ecosystem within the USA Tuna Fish market. Extensive desk research was conducted using both secondary and proprietary sources to gather industry-level data, focusing on supply chains, market drivers, and consumer behavior trends.
Step 2: Market Analysis and Construction
Historical data related to the USA Tuna Fish market was compiled and analyzed, assessing key market indicators such as demand for canned, frozen, and fresh tuna. Data from retail chains and industry reports were integrated to ensure accurate revenue estimates for each segment.
Step 3: Hypothesis Validation and Expert Consultation
We conducted interviews with industry experts, including representatives from leading tuna processors, distributors, and regulatory bodies. These consultations provided invaluable insights into operational challenges, fishing quotas, and sustainability certifications, which helped refine our market analysis.
Step 4: Research Synthesis and Final Output
Finally, data gathered from multiple sources was cross-validated with inputs from tuna fishing companies, processors, and major retailers. This process ensured that all market projections were based on concrete evidence, resulting in a robust and detailed market analysis.
Frequently Asked Questions
How big is the USA Tuna Fish Market?
The USA Tuna Fish market is valued at USD 7 billion, primarily driven by consumer demand for protein-rich foods and the growing popularity of canned and frozen tuna products.
What are the challenges in the USA Tuna Fish Market?
Challenges in the USA Tuna Fish market include fluctuating raw material costs, regulatory restrictions on tuna fishing quotas, and increasing competition from plant-based protein alternatives, all of which affect profitability.
Who are the major players in the USA Tuna Fish Market?
Key players in the USA Tuna Fish market include Bumble Bee Foods, Thai Union Group, Starkist Co., Tri Marine Group, and American Tuna Inc. These companies dominate through strong distribution networks, sustainability initiatives, and global partnerships.
What are the growth drivers of the USA Tuna Fish Market?
The USA Tuna Fish market is driven by increasing consumer awareness about the health benefits of tuna, rising demand for convenience foods, and expanding distribution channels across retail and online platforms.
Why Buy From Us?
 Framework")
What makes us stand out is that our consultants follows Robust, Refine and Result (RRR) methodology. i.e. Robust for clear definitions, approaches and sanity checking, Refine for differentiating respondents facts and opinions and Result for presenting data with story

We have set a benchmark in the industry by offering our clients with syndicated and customized market research reports featuring coverage of entire market as well as meticulous research and analyst insights.

While we don't replace traditional research, we flip the method upside down. Our dual approach of Top Bottom & Bottom Top ensures quality deliverable by not just verifying company fundamentals but also looking at the sector and macroeconomic factors.

With one step in the future, our research team constantly tries to show you the bigger picture. We help with some of the tough questions you may encounter along the way: How is the industry positioned? Best marketing channel? KPI's of competitors? By aligning every element, we help maximize success.

Our report gives you instant access to the answers and sources that other companies might choose to hide. We elaborate each steps of research methodology we have used and showcase you the sample size to earn your trust.

If you need any support, we are here! We pride ourselves on universe strength, data quality, and quick, friendly, and professional service.