
Vietnam Agriculture Market Outlook to 2030
Region:Asia
Author(s):Mukul
Product Code:KROD3361
October 2024
93
About the Report
Vietnam Agriculture
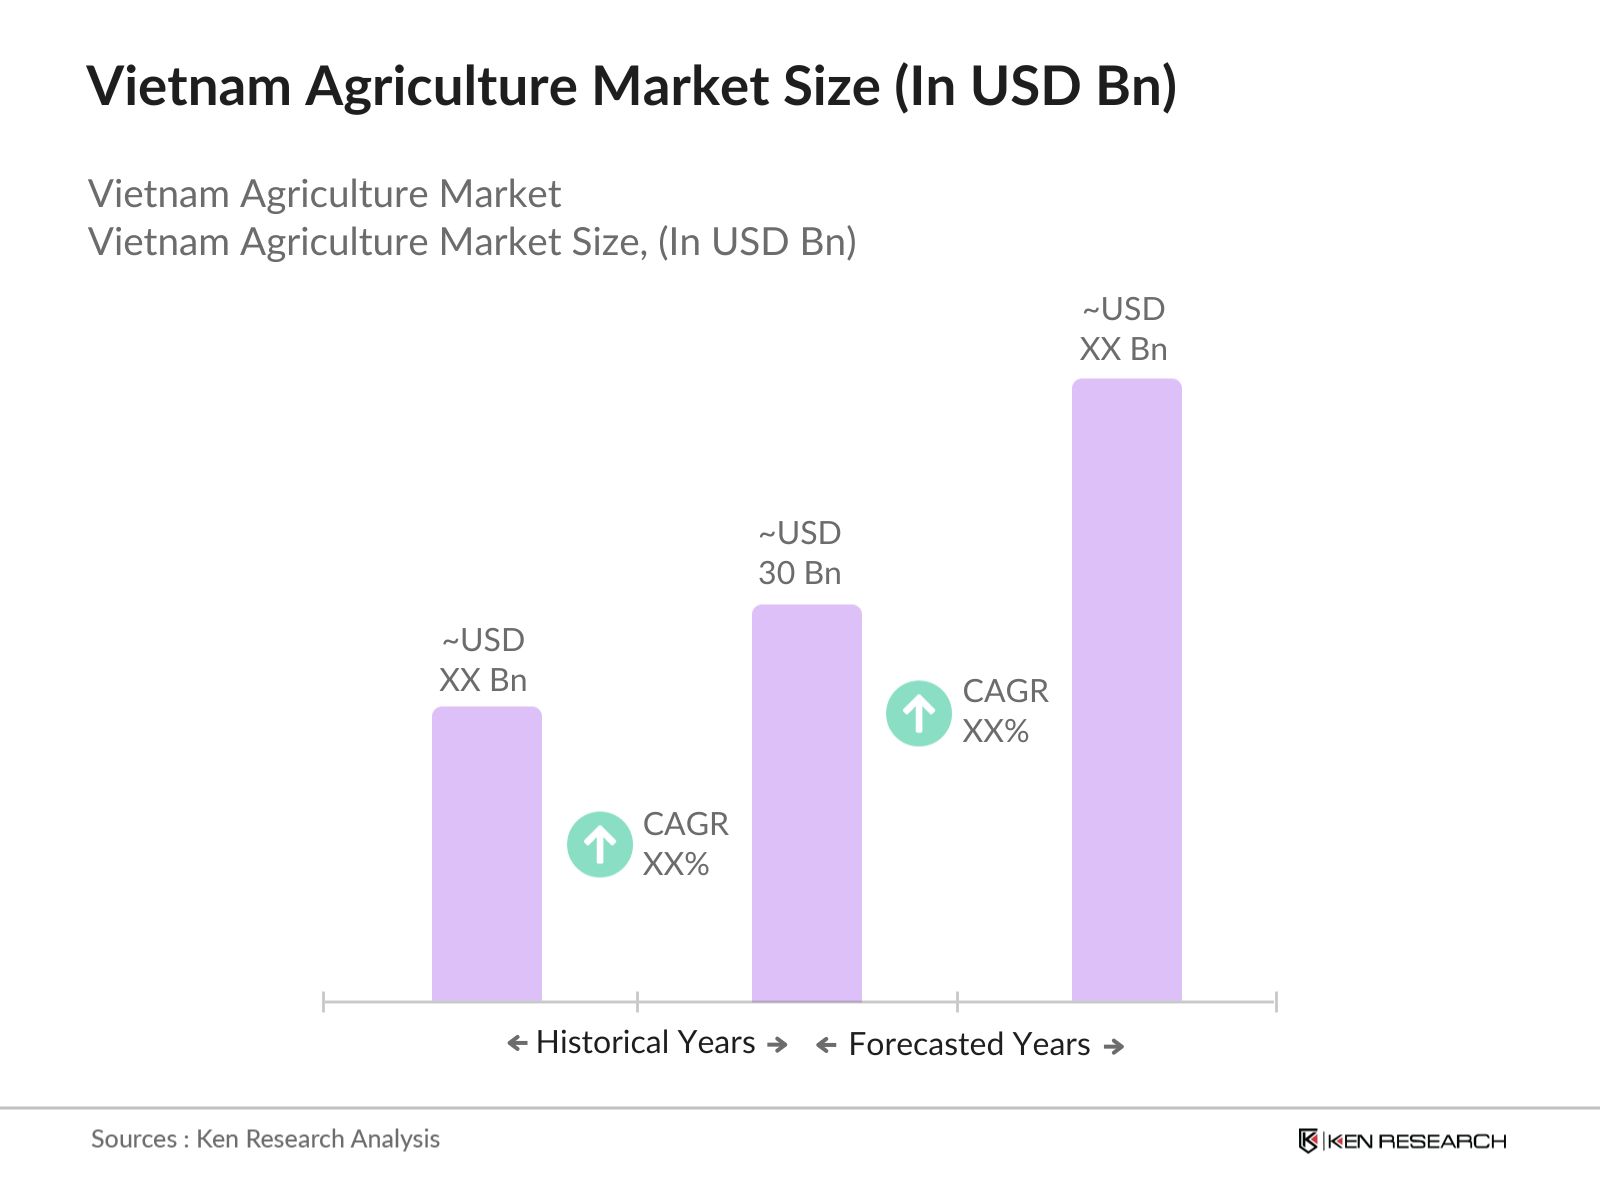
- The Vietnam Agriculture Market is valued at USD 30 billion, based on a five-year historical analysis. The market is driven by strong governmental support for modernizing agricultural practices and increasing foreign direct investment in the sector. The demand for agricultural exports, especially rice and seafood, remains robust, with rising global demand for organic and sustainable farming products further boosting the sector. Infrastructure development, such as irrigation and transportation networks, has also played a pivotal role in expanding the market.
- Key cities like Ho Chi Minh City and Hanoi dominate the agriculture market due to their well-developed infrastructure, proximity to key export ports, and access to advanced agricultural technologies. These cities serve as central hubs for agricultural trading and processing, helping them maintain their dominance. Ho Chi Minh City is particularly important due to its strategic position as the country's primary economic hub, while Hanoi benefits from its agricultural research institutions and government-backed initiatives aimed at increasing agricultural productivity.
- Vietnam’s National Agricultural Development Strategy aims to modernize the sector, with a focus on sustainable growth and international competitiveness. By 2025, the government plans to invest over $10 billion in infrastructure, training, and technology to boost agricultural productivity. The strategy emphasizes the integration of digital technologies, sustainable farming practices, and the development of value-added agricultural products. These initiatives are critical for meeting the growing demand for high-quality agricultural exports.
Vietnam Agriculture Market Segmentation
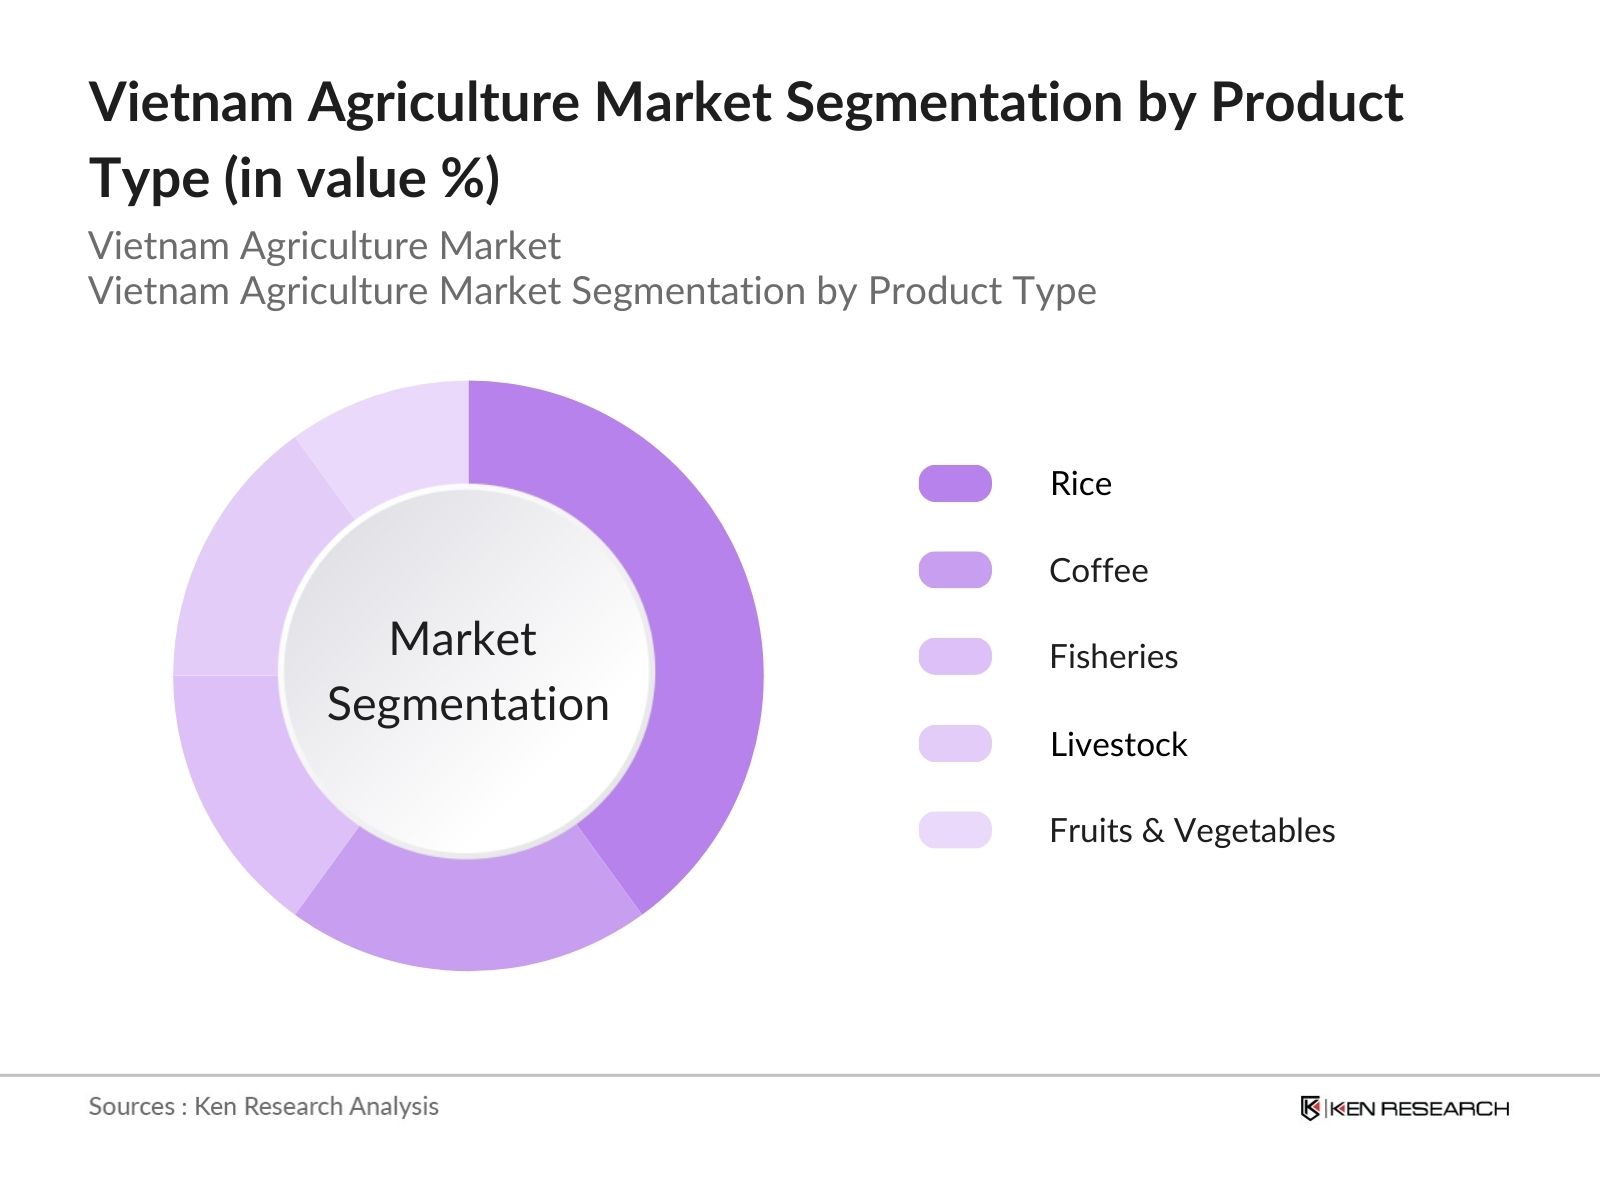
- By Product Type: Vietnam’s agriculture market is segmented by product type into rice, coffee, fisheries, livestock, and fruits & vegetables. Among these, rice has a dominated the market, primarily due to Vietnam’s position as one of the world’s largest rice exporters. The country’s favorable climate and government policies aimed at boosting rice production have further reinforced its dominance in this segment. Brands like Vinafood and Loc Troi Group play a significant role in maintaining this market position through large-scale production and exports.
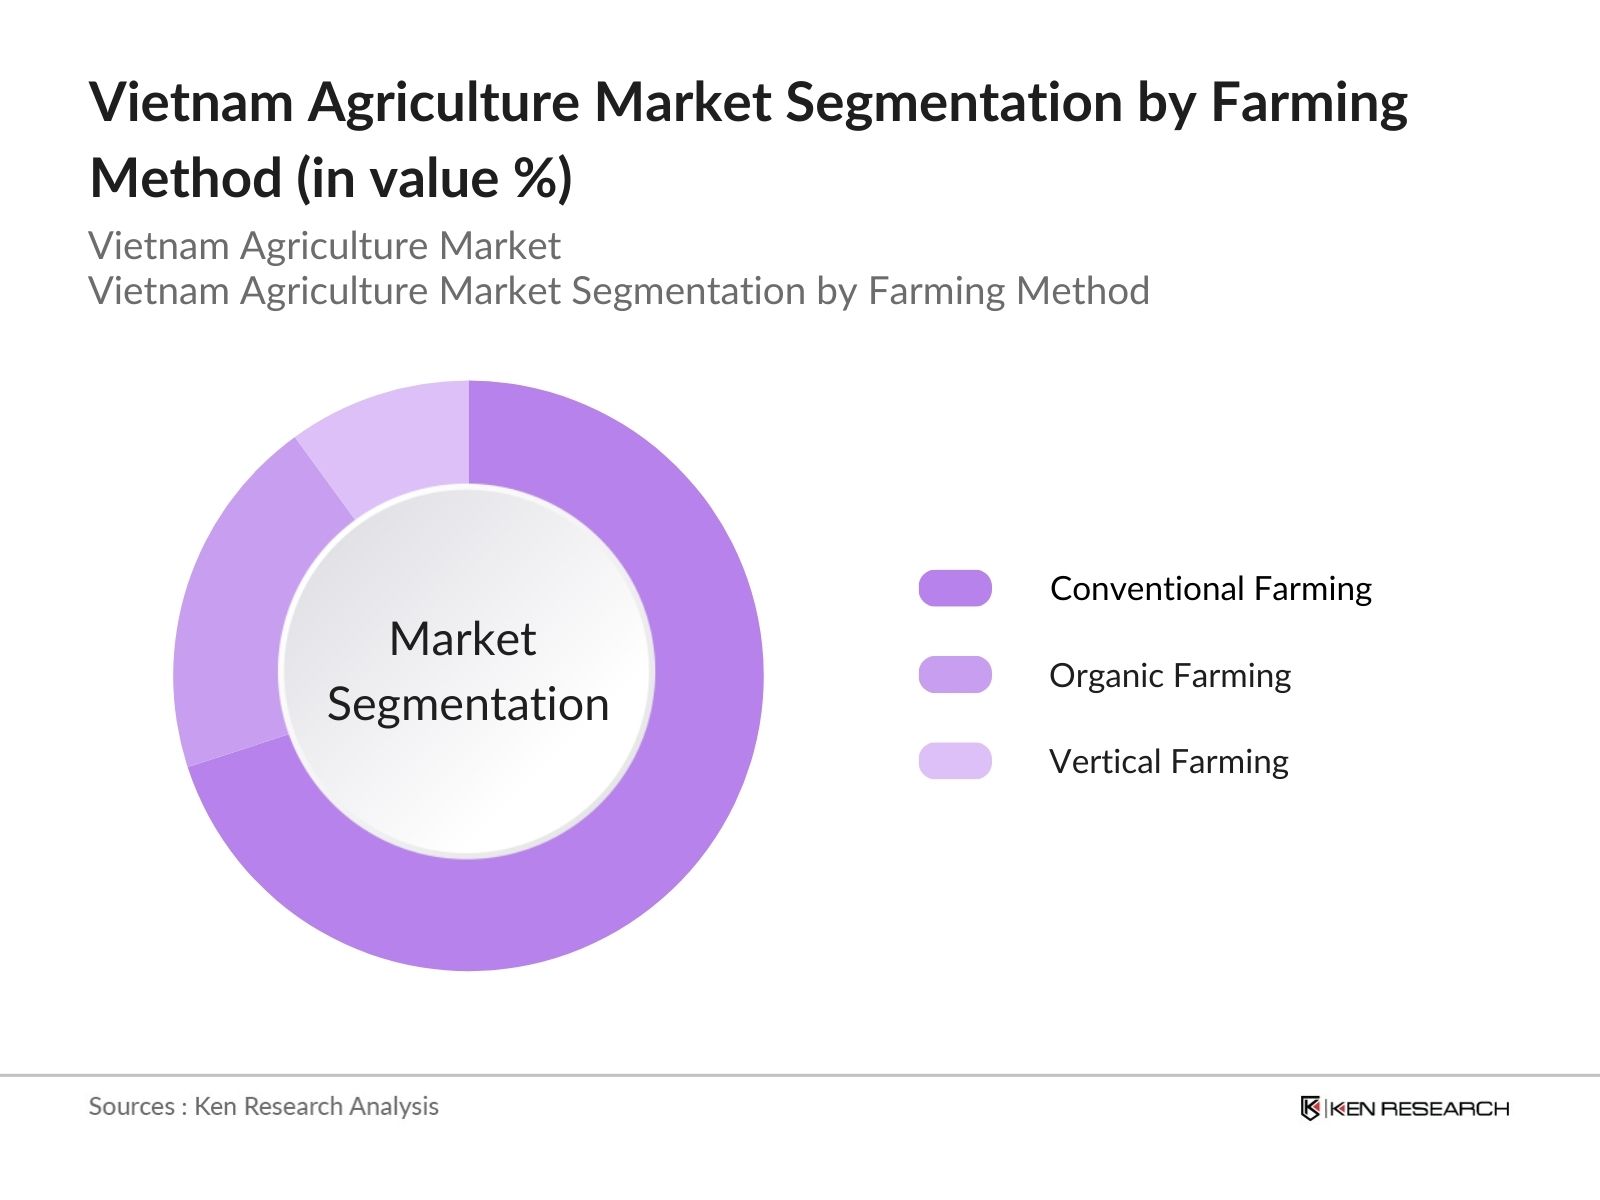
- By Farming Method: Vietnam’s agriculture is also segmented by farming method into conventional farming, organic farming, and vertical farming. Organic farming has been growing significantly, primarily driven by increasing consumer demand for healthier and pesticide-free products. Organic farming practices have seen more adoption due to growing awareness about sustainability, especially in urban markets. Companies like Nafoods Group and VinEco are leading the shift toward organic farming by adopting sustainable methods and entering international organic markets.
Vietnam Agriculture Market Competitive Landscape
The Vietnam agriculture market is dominated by both local and international companies, with key players focusing on increasing production capacity and adopting sustainable practices. The competitive landscape features large players like Vinafood 1 Corporation, known for its extensive export operations, and global brands like C.P. Vietnam Corporation, a major player in the livestock sector. These companies’ ability to leverage technology and scale operations has helped them maintain a significant market presence.
|
Company Name |
Establishment Year |
Headquarters |
Revenue (USD) |
Key Product |
Export Volume (Tons) |
Technology Adoption |
Sustainability Initiatives |
Market Penetration (%) |
|
Vinafood 1 Corporation |
1976 |
Hanoi |
|
|
|
|
|
|
|
Vietnam Dairy Products JSC |
1976 |
Ho Chi Minh City |
|
|
|
|
|
|
|
Masan Group Corporation |
2004 |
Ho Chi Minh City |
|
|
|
|
|
|
|
Nafoods Group JSC |
1995 |
Nghe An Province |
|
|
|
|
|
|
|
C.P. Vietnam Corporation |
1988 |
Ho Chi Minh City |
|
|
|
|
|
|
Vietnam Agriculture Industry Analysis
Vietnam Agriculture MarketGrowth Drivers
- Expansion of Agri-Tech: Vietnam's agriculture sector has witnessed a rapid expansion in Agri-Tech adoption, contributing to enhanced productivity. Technologies like drones, satellite monitoring, and precision farming are increasingly used for efficient crop management. For instance, Vietnam has invested $4.3 billion into precision farming technologies by 2023, significantly improving yields. Government initiatives, such as the National Digital Transformation Program, aim to digitalize farming practices across 30 million hectares of farmland by 2025, fostering sustainable growth in the sector. These efforts are vital for maintaining high agricultural output in a country where 60% of the population relies on farming.
- Improved Irrigation Systems: Vietnam has focused on improving its irrigation systems to bolster agricultural productivity. The country has allocated nearly $2 billion toward modernizing irrigation infrastructure, aiming to cover an additional 1.2 million hectares by 2025. As a result, farmers can cultivate multiple crop cycles annually, which supports rice and coffee, two of the country’s main exports. In 2024, Vietnam’s agricultural sector benefited from water-saving irrigation systems that helped maintain crop production during seasonal droughts, significantly reducing water usage by 30%.
- Increase in Foreign Direct Investments: FDI in Vietnam's agricultural sector has surged, reaching $1.7 billion in 2023. Investors are attracted by the country's rich natural resources, low labor costs, and export potential. Foreign companies are particularly interested in sectors such as aquaculture and organic farming. The government has also eased regulations, enabling easier access for international investors to acquire land for agricultural purposes. This influx of capital has resulted in technological upgrades and better management practices, significantly boosting productivity and exports.
Vietnam Agriculture Market Restraints
- Climate Change: Vietnam's agricultural sector faces significant challenges due to climate change, particularly rising temperatures and unpredictable rainfall. According to the Vietnam Ministry of Natural Resources and Environment, more than 20% of the Mekong Delta, which produces half of the country’s rice, could be underwater by 2050. In 2024, agricultural losses from extreme weather conditions, including floods and droughts, amounted to over $900 million. The government is urgently implementing climate-resilient farming methods but adapting at scale remains a challenge for many smallholder farmers.
- Limited Arable Land: Vietnam’s arable land has diminished due to urbanization and industrial development. In 2023, the country's total arable land decreased to around 8.7 million hectares from 9 million in 2019. This decline has stressed the agricultural sector, forcing farmers to maximize yields on shrinking plots. Additionally, the competition for land between agricultural and industrial use continues to increase. Vietnam’s government is working on policies to protect agricultural land through land-use regulations, yet the challenge persists as the population grows.
Vietnam Agriculture Market Future Outlook
Over the next five years, the Vietnam agriculture market is expected to experience significant growth driven by the increasing demand for sustainable farming practices, ongoing government support, and expansion of export markets. Innovations in agri-tech, such as precision farming and smart irrigation, are likely to play a central role in boosting agricultural productivity. As more global consumers seek organic and environmentally sustainable products, Vietnam's organic farming sector will likely see substantial growth. Investments in infrastructure, coupled with favorable trade agreements, are also expected to open new international markets for Vietnamese agricultural products.
Market Opportunities
- Precision Farming: The adoption of precision farming in Vietnam presents a significant growth opportunity. With over 15% of agricultural land already benefiting from precision farming techniques, the sector is set for further expansion. By utilizing data from sensors and satellite imaging, farmers can optimize water and fertilizer usage, reducing costs and increasing yields. In 2023, precision farming increased rice yields by 12% in the Red River Delta. This innovation will play a crucial role in maximizing agricultural productivity, especially in regions facing land constraints.
- Increased Demand for Organic Products: There is growing demand for organic agricultural products in both domestic and international markets. Vietnam’s organic farming sector exported goods worth $450 million in 2023, a figure expected to grow as global consumers continue seeking eco-friendly products. This demand has spurred farmers to adopt organic farming practices, further supported by government subsidies. In 2024, organic rice and coffee exports were the most significant contributors to this sector, offering a lucrative market opportunity.
Scope of the Report
|
Product Type |
Crops (Rice, Coffee, Pepper, Fruits, Vegetables) |
|
Livestock (Poultry, Cattle, Pigs) |
|
|
Fisheries and Aquaculture |
|
|
Farming Method |
Conventional Farming |
|
Organic Farming |
|
|
Vertical Farming |
|
|
Technology Adoption |
Precision Agriculture |
|
Smart Irrigation |
|
|
Drones and Satellite Imaging |
|
|
End Market |
Domestic Consumption |
|
Export Markets |
|
|
Region |
Northern |
|
Central |
|
|
Southern |
Products
Key Target Audience
- Government and Regulatory Bodies (Ministry of Agriculture and Rural Development, Vietnam)
- Agricultural Equipment Manufacturers
- Organic Farming Cooperatives
- Food and Beverage Manufacturers
- Export Agencies
- Investments and Venture Capitalist Firms
- Agri-Tech Startups
- Livestock and Poultry Farms
Time Period Captured in the Report:
- Historical Period: 2018-2023
- Base Year: 2023
- Forecast Period: 2023-2028
Companies
- Vinafood 1 Corporation
- Vietnam Dairy Products JSC (Vinamilk)
- Masan Group Corporation
- Nafoods Group JSC
- C.P. Vietnam Corporation
- Minh Phu Seafood Corporation
- An Giang Fisheries Import Export JSC
- TH Group
- Hoang Anh Gia Lai JSC
- Loc Troi Group JSC
- Tan Long Group
- Quang Minh Agro JSC
- Bunge Vietnam
- FLC Group
- Dabaco Group
Table of Contents
1. Vietnam Agriculture Market Overview
1.1. Definition and Scope
1.2. Market Taxonomy
1.3. Market Growth Rate
1.4. Market Segmentation Overview
2. Vietnam Agriculture Market Size (In USD Bn)
2.1. Historical Market Size
2.2. Year-on-Year Growth Analysis
2.3. Key Market Developments and Milestones
3. Vietnam Agriculture Market Analysis
3.1. Growth Drivers (Agricultural productivity, Rural development policies, Government subsidies)
3.1.1. Expansion of Agri-Tech
3.1.2. Improved Irrigation Systems
3.1.3. Increase in Foreign Direct Investments
3.1.4. Adoption of Organic Farming Practices
3.2. Market Challenges (Climate Change, Limited Arable Land, Agricultural Labor Shortage)
3.2.1. High Dependency on Weather Conditions
3.2.2. Price Volatility in Commodities
3.2.3. Limited Access to Advanced Technologies for Small-Scale Farmers
3.3. Opportunities (Agri-Tech Innovations, Export Market Expansion, Crop Diversification)
3.3.1. Precision Farming
3.3.2. Increased Demand for Organic Products
3.3.3. Regional Trade Agreements Opening New Markets
3.4. Trends (Sustainable Agriculture Practices, Smart Farming, Digital Transformation)
3.4.1. Adoption of Smart Irrigation Systems
3.4.2. Usage of Artificial Intelligence in Crop Monitoring
3.4.3. Increasing Consumer Demand for Sustainable Food Sources
3.5. Government Regulations (Trade Policies, Agricultural Subsidies, Sustainable Agriculture Programs)
3.5.1. National Agricultural Development Strategy
3.5.2. Export Regulations and Trade Quotas
3.5.3. Food Safety Standards and Certifications
3.6. SWOT Analysis (Strengths, Weaknesses, Opportunities, Threats)
3.7. Stakeholder Ecosystem (Government Agencies, Farmers, Cooperatives, Input Suppliers, Retailers)
3.8. Porter’s Five Forces (Bargaining Power of Buyers, Bargaining Power of Suppliers, Threat of New Entrants, Threat of Substitutes, Competitive Rivalry)
3.9. Competitive Landscape (Overview of Key Players, Market Positioning)
4. Vietnam Agriculture Market Segmentation
4.1. By Product Type (In Value %)
4.1.1. Crops (Rice, Coffee, Pepper, Fruits, Vegetables)
4.1.2. Livestock (Poultry, Cattle, Pigs)
4.1.3. Fisheries and Aquaculture
4.2. By Farming Method (In Value %)
4.2.1. Conventional Farming
4.2.2. Organic Farming
4.2.3. Vertical Farming
4.3. By Technology Adoption (In Value %)
4.3.1. Precision Agriculture
4.3.2. Smart Irrigation
4.3.3. Drones and Satellite Imaging
4.4. By End Market (In Value %)
4.4.1. Domestic Consumption
4.4.2. Export Markets
4.5. By Region (In Value %)
4.5.1. Northern Vietnam
4.5.2. Central Vietnam
4.5.3. Southern Vietnam
5. Vietnam Agriculture Market Competitive Analysis
5.1. Detailed Profiles of Major Companies
5.1.1. Vinafood 1 Corporation
5.1.2. Vietnam Dairy Products JSC (Vinamilk)
5.1.3. Masan Group Corporation
5.1.4. Nafoods Group JSC
5.1.5. Minh Phu Seafood Corporation
5.1.6. An Giang Fisheries Import Export JSC
5.1.7. TH Group
5.1.8. Hoang Anh Gia Lai JSC
5.1.9. Loc Troi Group JSC
5.1.10. Tan Long Group
5.1.11. Quang Minh Agro JSC
5.1.12. C.P. Vietnam Corporation
5.1.13. Bunge Vietnam
5.1.14. FLC Group
5.1.15. Dabaco Group
5.2. Cross Comparison Parameters (Revenue, Market Share, Production Capacity, Geographical Presence, Technological Advancements, Partnerships, Product Portfolio, Sustainability Initiatives)
5.3. Market Share Analysis
5.4. Strategic Initiatives
5.5. Mergers and Acquisitions
5.6. Investment Analysis
5.7. Government Grants and Subsidies
5.8. Venture Capital Funding
5.9. Private Equity Investments
6. Vietnam Agriculture Market Regulatory Framework
6.1. Environmental Standards
6.2. Food Safety Regulations
6.3. Export and Import Regulations
7. Vietnam Agriculture Future Market Size (In USD Bn)
7.1. Future Market Size Projections
7.2. Key Factors Driving Future Market Growth
8. Vietnam Agriculture Future Market Segmentation
8.1. By Product Type (In Value %)
8.2. By Farming Method (In Value %)
8.3. By Technology Adoption (In Value %)
8.4. By End Market (In Value %)
8.5. By Region (In Value %)
9. Vietnam Agriculture Market Analyst’s Recommendations
9.1. TAM/SAM/SOM Analysis
9.2. Customer Cohort Analysis
9.3. Marketing Initiatives
9.4. White Space Opportunity Analysis
Disclaimer
Contact Us
Research Methodology
Step 1: Identification of Key Variables
The first phase involved identifying the key variables in Vietnam’s agriculture market through comprehensive desk research, utilizing both public and proprietary databases. This step focused on understanding the key stakeholders, including major farming cooperatives, government policies, and technology providers.
Step 2: Market Analysis and Construction
The second phase involved analyzing historical market data, including agricultural production volumes, export statistics, and key drivers of revenue growth. This analysis was further supported by field research data obtained from industry reports and government publications.
Step 3: Hypothesis Validation and Expert Consultation
In the third phase, hypotheses regarding market drivers, challenges, and growth opportunities were validated through interviews with key market stakeholders, including agriculture industry leaders, policy makers, and farming associations. Their insights helped refine the data points, ensuring accuracy.
Step 4: Research Synthesis and Final Output
The final stage involved synthesizing the data collected from various sources and producing a cohesive analysis that covered all market segments. This synthesis ensured that the final output was validated, with insights from both quantitative and qualitative data sources providing a well-rounded view of the market.
Frequently Asked Questions
01. How big is the Vietnam Agriculture Market?
The Vietnam agriculture market is valued at USD 30 billion, driven by its significant contributions to both the domestic economy and international exports, particularly rice and seafood.
02. What are the challenges in the Vietnam Agriculture Market?
Challenges in the Vietnam agriculture market include unpredictable weather patterns due to climate change, labor shortages in rural areas, and price fluctuations in key agricultural commodities.
03. Who are the major players in the Vietnam Agriculture Market?
Key players in the Vietnam agriculture market include Vinafood 1 Corporation, Vietnam Dairy Products JSC (Vinamilk), Masan Group Corporation, Nafoods Group JSC, and C.P. Vietnam Corporation, all of whom dominate through their extensive production capacities and export activities.
04. What are the growth drivers of the Vietnam Agriculture Market?
The Vietnam agriculture market growth is driven by strong government support, advances in agricultural technologies, increasing demand for organic produce, and expanding export opportunities due to favorable trade agreements.
|
Product Type |
Market Share (2023) |
|
Rice |
40% |
|
Coffee |
20% |
|
Fisheries |
15% |
|
Livestock |
15% |
|
Fruits & Vegetables |
10% |
|
|
|
|
Farming Method |
Market Share (2023) |
|
Conventional Farming |
70% |
|
Organic Farming |
20% |
|
Vertical Farming |
10% |
Why Buy From Us?
 Framework")
What makes us stand out is that our consultants follows Robust, Refine and Result (RRR) methodology. i.e. Robust for clear definitions, approaches and sanity checking, Refine for differentiating respondents facts and opinions and Result for presenting data with story

We have set a benchmark in the industry by offering our clients with syndicated and customized market research reports featuring coverage of entire market as well as meticulous research and analyst insights.

While we don't replace traditional research, we flip the method upside down. Our dual approach of Top Bottom & Bottom Top ensures quality deliverable by not just verifying company fundamentals but also looking at the sector and macroeconomic factors.

With one step in the future, our research team constantly tries to show you the bigger picture. We help with some of the tough questions you may encounter along the way: How is the industry positioned? Best marketing channel? KPI's of competitors? By aligning every element, we help maximize success.

Our report gives you instant access to the answers and sources that other companies might choose to hide. We elaborate each steps of research methodology we have used and showcase you the sample size to earn your trust.

If you need any support, we are here! We pride ourselves on universe strength, data quality, and quick, friendly, and professional service.