
KSA Formic Acid Market Outlook to 2030
Region:Saudi Arabia
Author(s):Shubham Kashyap
Product Code:KROD618
Region:Saudi Arabia
Author(s):Shubham Kashyap
Product Code:KROD618
November 2024
88
The KSA Formic Acid market is moderately competitive, with several key players providing high-quality products to various industries. Major companies like BASF SE, Perstorp, and Feicheng Acid Chemical dominate the market, offering a wide range of formic acid concentrations and applications. These companies focus on innovation, product development, and partnerships to maintain their competitive edge. Local players like Arabian Chemical Company are also key participants, leveraging their strong distribution networks and competitive pricing strategies to supply formic acid to industries across KSA.
|
Company Name |
Establishment Year |
Headquarters |
Production Capacity (Tons/Year) |
Revenue (2023) |
Key Products |
R&D Investment |
Distribution Network |
Sustainability Initiatives |
Market Presence (Global/Regional) |
|
BASF SE |
1865 |
Germany |
- |
- |
- |
- |
- |
- |
- |
|
Perstorp |
1881 |
Sweden |
- |
- |
- |
- |
- |
- |
- |
|
Feicheng Acid Chemical |
1998 |
China |
- |
- |
- |
- |
- |
- |
- |
|
Arabian Chemical Company |
1992 |
Saudi Arabia |
- |
- |
- |
- |
- |
- |
- |
|
Gujarat Narmada Valley Fertilizers |
1976 |
India |
- |
- |
- |
- |
- |
- |
- |
Growth Drivers:
Market Challenges:
The KSA Formic Acid market is expected to grow steadily over the forecast period, driven by increasing demand in agriculture, leather, and textile industries. The governments Vision 2030 initiative, focusing on expanding non-oil sectors, will create significant opportunities for formic acid applications in various industries. Furthermore, the rising demand for eco-friendly chemicals and preservatives will bolster market growth.
Future Market Opportunities:
|
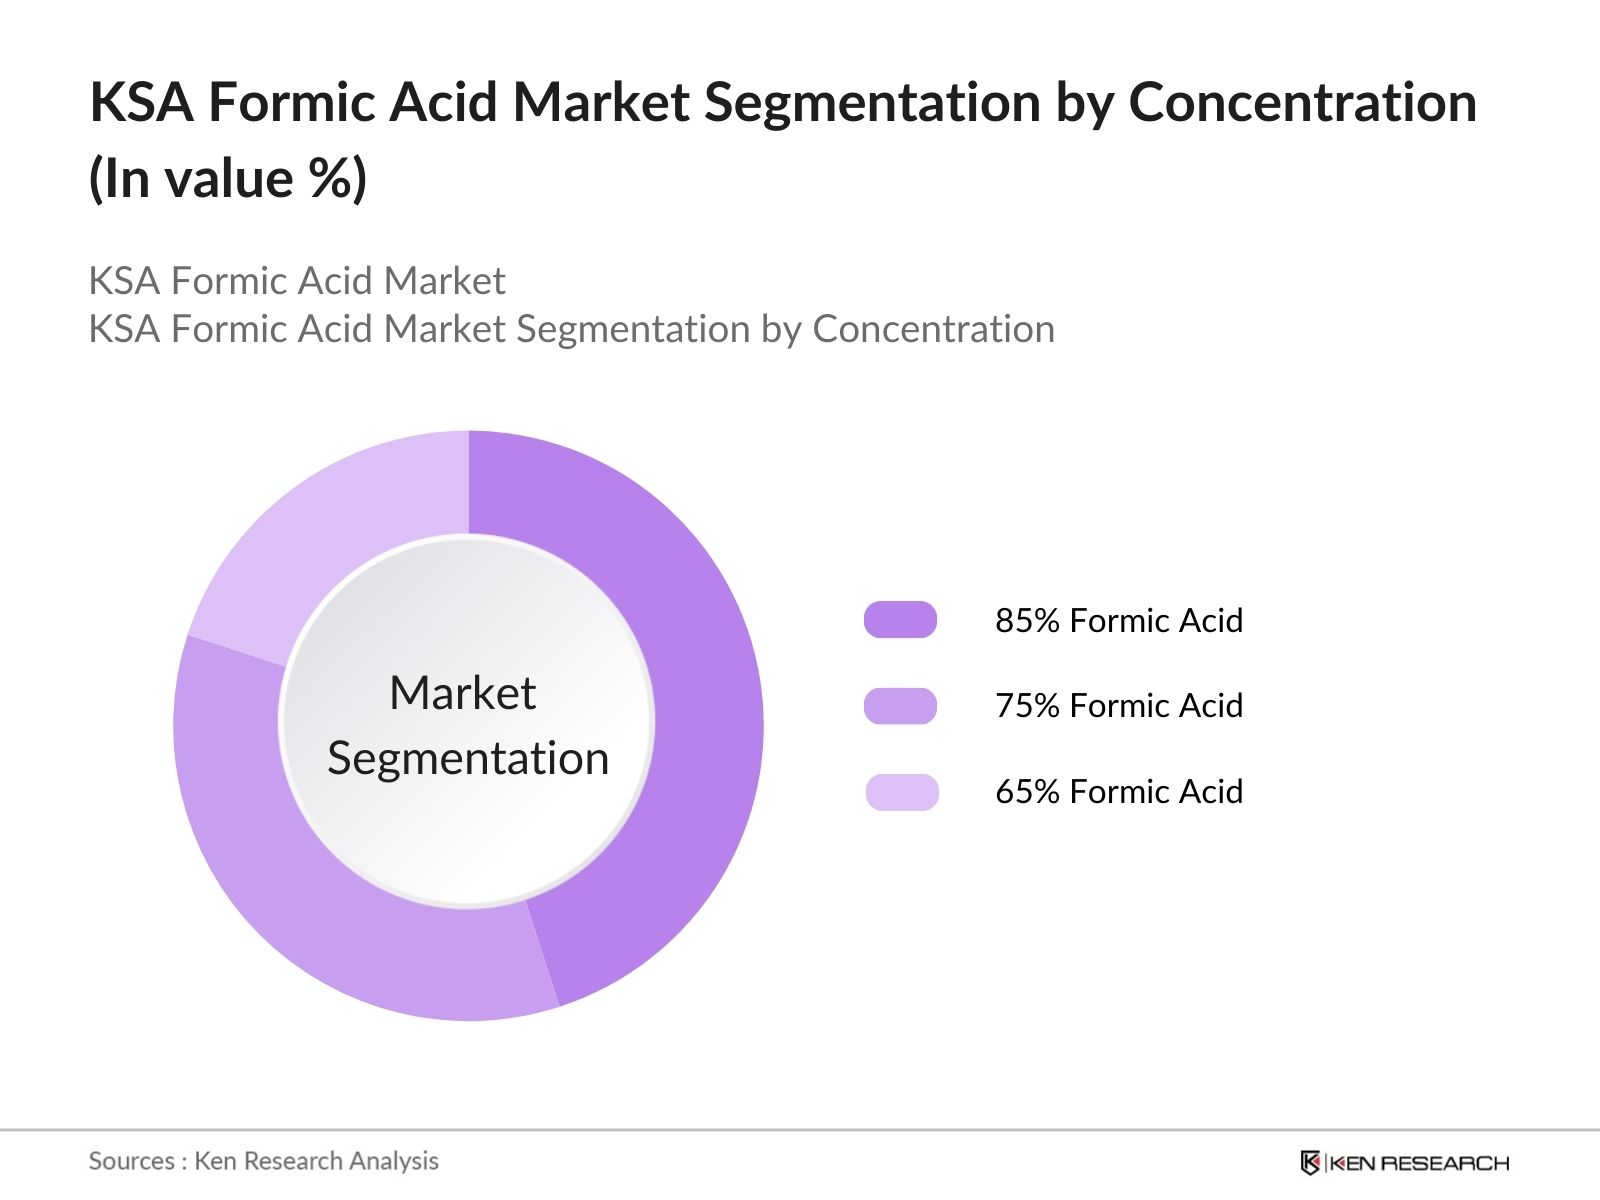
By Concentration |
85% Formic Acid 75% Formic Acid 65% Formic Acid |
|
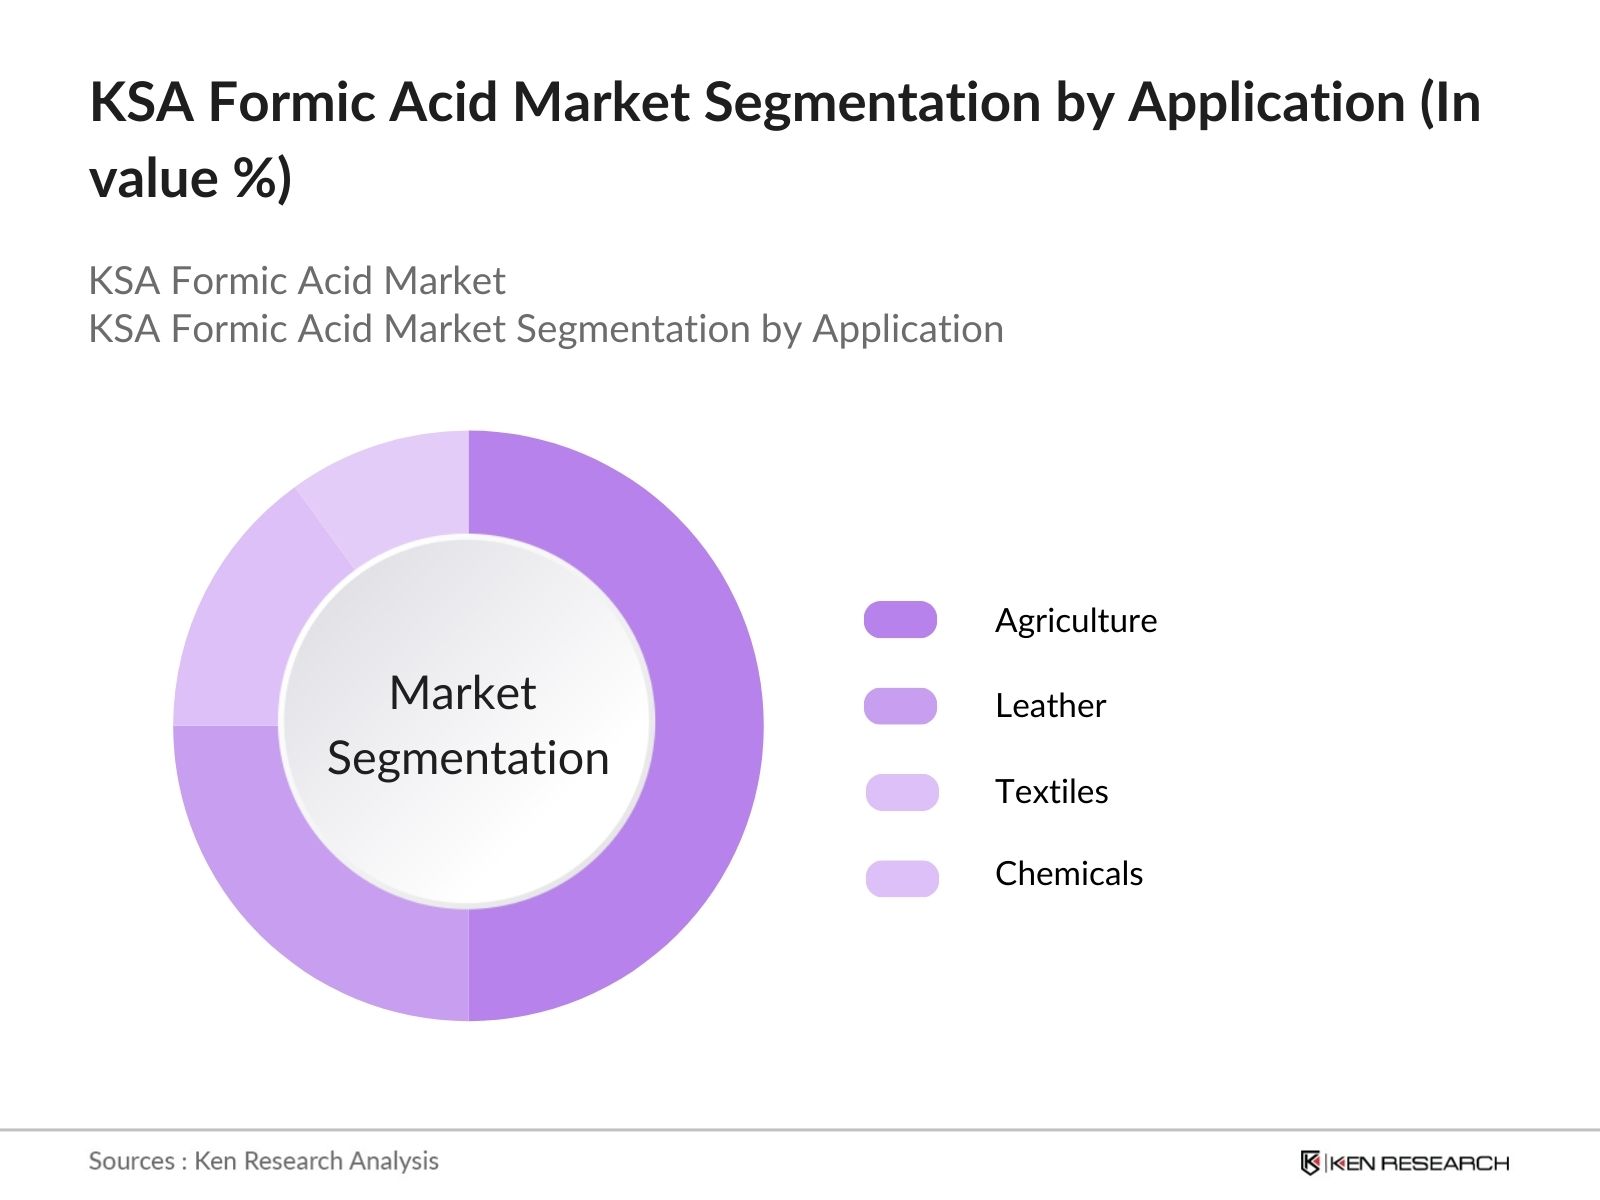
By Application |
Agriculture (Feed Preservative) Leather (Tanning Process) Textile (Dye Fixing) Rubber and Chemicals Others (Food and Beverage, Pharmaceuticals) |
|
By Application |
Cutting & Welding Chemical Processing Healthcare Refining |
|
By End-User |
Agriculture Leather Textile Chemicals Food & Beverage |
|
By Distribution Channel |
Direct Sales Distributors |
|
By Region |
Riyadh Jeddah Jubail Other Regions |
1.1. Definition and Scope
1.2. Market Taxonomy
1.3. Market Growth Rate
1.4. Market Segmentation Overview
2.1. Historical Market Size
2.2. Year-On-Year Growth Analysis
2.3. Key Market Developments and Milestones
3.1. Growth Drivers
3.1.1. Expansion of Agriculture Sector (Increased Use in Animal Feed Preservatives)
3.1.2. Revival of Leather Industry (High Demand for Tanning Applications)
3.1.3. Rise of Textile Manufacturing (Formic Acid for Dye Fixing)
3.1.4. Rising Chemical Manufacturing (Formic Acid for Synthesis and Industrial Use)
3.2. Market Challenges
3.2.1. High Production Costs (Energy Consumption in Formic Acid Production)
3.2.2. Environmental Regulations (Sustainability and Eco-friendly Production)
3.2.3. Logistics and Distribution Barriers (Geographical and Infrastructural Limitations)
3.3. Opportunities
3.3.1. Advancements in Local Production (Government Incentives for Domestic Manufacturing)
3.3.2. Growth of Formic Acid Substitutes in New Applications (Innovations in Use Cases)
3.3.3. Rising Demand for Bio-based Formic Acid (Eco-friendly Alternatives)
3.4. Trends
3.4.1. Technological Advancements in Production (Smart Monitoring Systems)
3.4.2. Increasing Preference for High-Quality Preservatives (Agriculture and Food Sectors)
3.4.3. Use in Emerging Chemical Applications (New Synthesis Processes)
3.5. Government Regulation
3.5.1. Environmental Standards (Compliance and Sustainability Targets)
3.5.2. Import and Export Tariffs (Impact on Global Trade)
3.5.3. Incentives for Local Production (Vision 2030 Policies)
3.6. SWOT Analysis
3.7. Stakeholder Ecosystem
3.8. Porters Five Forces Analysis
3.9. Competition Ecosystem
4.1. By Concentration (In Value %)
4.1.1. 85% Formic Acid
4.1.2. 75% Formic Acid
4.1.3. 65% Formic Acid
4.1.4. Other Concentrations
4.2. By Application (In Value %)
4.2.1. Agriculture (Feed Preservative)
4.2.2. Leather (Tanning Process)
4.2.3. Textile (Dye Fixing)
4.2.4. Rubber and Chemicals
4.2.5. Others (Food and Beverage, Pharmaceuticals)
4.3. By End-User Industry (In Value %)
4.3.1. Agriculture
4.3.2. Leather
4.3.3. Textile
4.3.4. Chemicals
4.3.5. Food & Beverage
4.4. By Distribution Channel (In Value %)
4.4.1. Direct Sales
4.4.2. Distributors
4.5. By Region (In Value %)
4.5.1. Riyadh
4.5.2. Jeddah
4.5.3. Jubail
4.5.4. Other Regions
5.1. Detailed Profiles of Major Companies
5.1.1. BASF SE
5.1.2. Perstorp
5.1.3. Feicheng Acid Chemical
5.1.4. Eastman Chemical Company
5.1.5. Gujarat Narmada Valley Fertilizers & Chemicals (GNFC)
5.1.6. Luxi Chemical Group
5.1.7. Chongqing Chuandong Chemical
5.1.8. National Company for Sulfur Products
5.1.9. Rashtriya Chemicals and Fertilizers
5.1.10. Taminco Corporation
5.1.11. Methanol Chemicals Company (Chemanol)
5.1.12. Alfa Aesar
5.1.13. Shandong Baoyuan Chemical
5.1.14. ACATEL S.A
5.1.15. Arabian Chemical Company
5.2. Cross Comparison Parameters (Production Capacity, Market Share, Innovation Focus, Regional Presence, Revenue, Distribution Network, Number of Employees, Sustainability Initiatives)
5.3. Market Share Analysis
5.4. Strategic Initiatives
5.5. Mergers and Acquisitions
5.6. Investment Analysis
5.7. Private Equity Investments
5.8. Joint Ventures and Partnerships
6.1. Compliance with International Standards (SASO, REACH)
6.2. Import and Export Regulations (Customs Duties and Tariffs)
6.3. Environmental Certifications and Sustainability Targets
7.1. Future Market Size Projections
7.2. Key Factors Driving Future Market Growth
8.1. By Concentration (In Value %)
8.2. By Application (In Value %)
8.3. By End-User Industry (In Value %)
8.4. By Distribution Channel (In Value %)
8.5. By Region (In Value %)
9.1. TAM/SAM/SOM Analysis
9.2. Key Growth Areas for Investment
9.3. Customer Segmentation and Profiling
9.4. Marketing and Product Launch Strategy Recommendations
The research begins by mapping the ecosystem of the KSA Formic Acid market. Comprehensive desk research is conducted using secondary data from industry reports, proprietary databases, and publications. The focus is on identifying critical market drivers, production capacities, and demand patterns in major application areas.
This phase involves compiling and analyzing historical market data on formic acid production, consumption, and revenue generation across various segments. Market dynamics such as supply-demand gaps and consumption trends are closely evaluated to assess the growth trajectory.
Market hypotheses are developed based on the data collected and validated through expert interviews with industry professionals, including formic acid producers, distributors, and key end-users. These insights provide real-time operational feedback and validate the trends identified in earlier phases.
The final step involves synthesizing the research findings into actionable insights. Detailed market forecasts, segmentation analyses, and company profiles are developed to offer a comprehensive view of the KSA Formic Acid market. Industry validation is conducted to ensure accuracy.
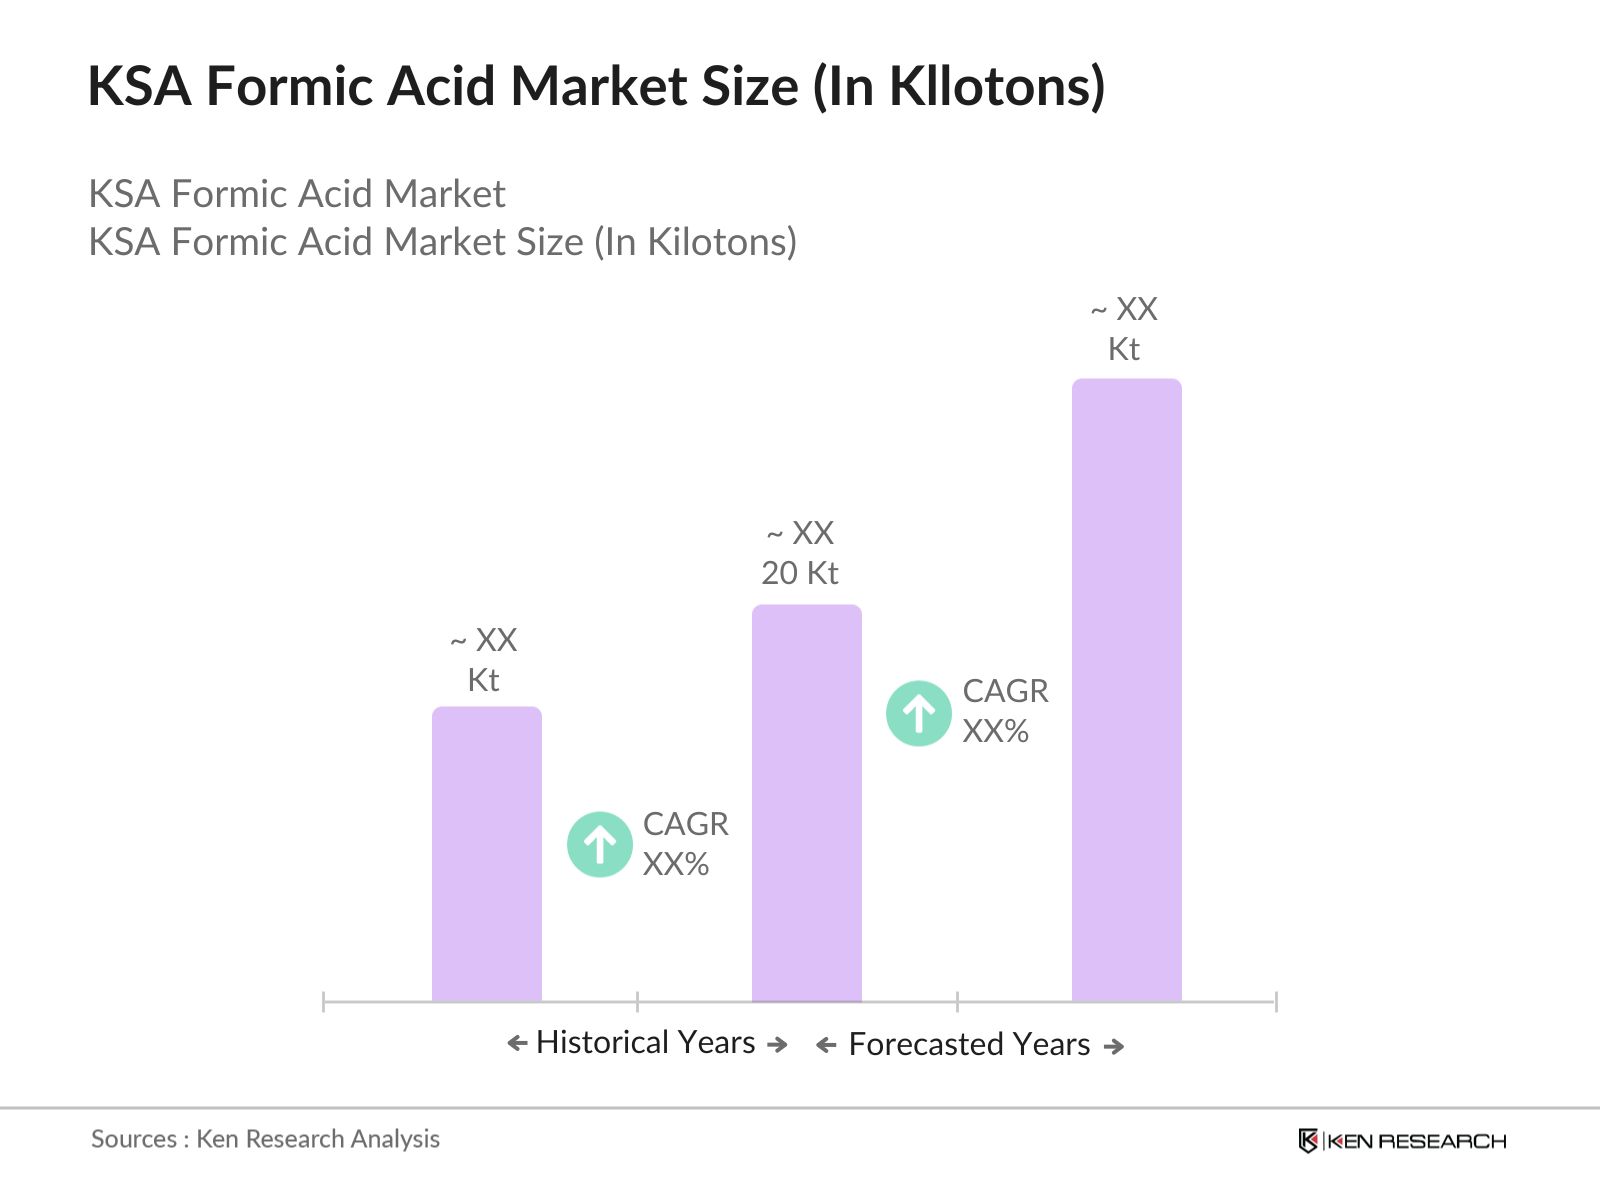
The KSA Formic Acid market is valued at 20 kilotons, driven primarily by demand from the agriculture and leather industries.
Challenges in the KSA Formic Acid market include high production and storage costs due to energy-intensive manufacturing processes, as well as logistical barriers that affect the timely distribution of formic acid across the country.
Key players in the KSA Formic Acid market include BASF SE, Perstorp, Feicheng Acid Chemical, and Arabian Chemical Company, which dominate due to their production capacities, established distribution networks, and diverse product offerings.
Growth drivers in the KSA Formic Acid market include the expanding agriculture sector, increasing demand for animal feed preservatives, and the revival of the leather and textile industries. The push towards local production and diversification under Vision 2030 also contributes to market growth.
 Framework")
What makes us stand out is that our consultants follows Robust, Refine and Result (RRR) methodology. i.e. Robust for clear definitions, approaches and sanity checking, Refine for differentiating respondents facts and opinions and Result for presenting data with story

We have set a benchmark in the industry by offering our clients with syndicated and customized market research reports featuring coverage of entire market as well as meticulous research and analyst insights.

While we don't replace traditional research, we flip the method upside down. Our dual approach of Top Bottom & Bottom Top ensures quality deliverable by not just verifying company fundamentals but also looking at the sector and macroeconomic factors.

With one step in the future, our research team constantly tries to show you the bigger picture. We help with some of the tough questions you may encounter along the way: How is the industry positioned? Best marketing channel? KPI's of competitors? By aligning every element, we help maximize success.

Our report gives you instant access to the answers and sources that other companies might choose to hide. We elaborate each steps of research methodology we have used and showcase you the sample size to earn your trust.

If you need any support, we are here! We pride ourselves on universe strength, data quality, and quick, friendly, and professional service.