About the Report
Base Year 2024Poland E-Learning and Digital Education Market Overview
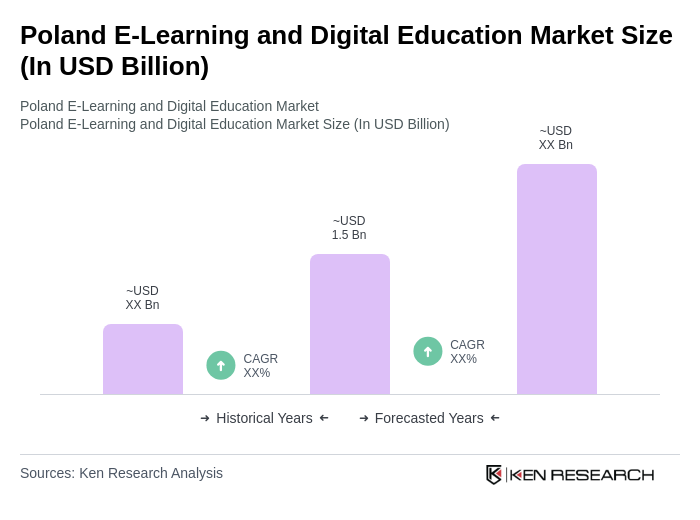
- The Poland E-Learning and Digital Education Market is valued at USD 1.5 billion, based on a five-year historical analysis. This growth is primarily driven by the increasing adoption of digital learning solutions in educational institutions and corporate training programs, alongside a growing demand for flexible learning options among students and professionals.
- Key cities such as Warsaw, Kraków, and Wroc?aw dominate the market due to their robust educational infrastructure, high internet penetration rates, and a concentration of technology companies. These urban centers are hubs for innovation and digital transformation, fostering a conducive environment for e-learning growth.
- In 2023, the Polish government implemented a regulation mandating the integration of digital education tools in K-12 curricula. This initiative aims to enhance digital literacy among students and ensure that educational institutions are equipped with the necessary resources to facilitate effective online learning.
Poland E-Learning and Digital Education Market Segmentation
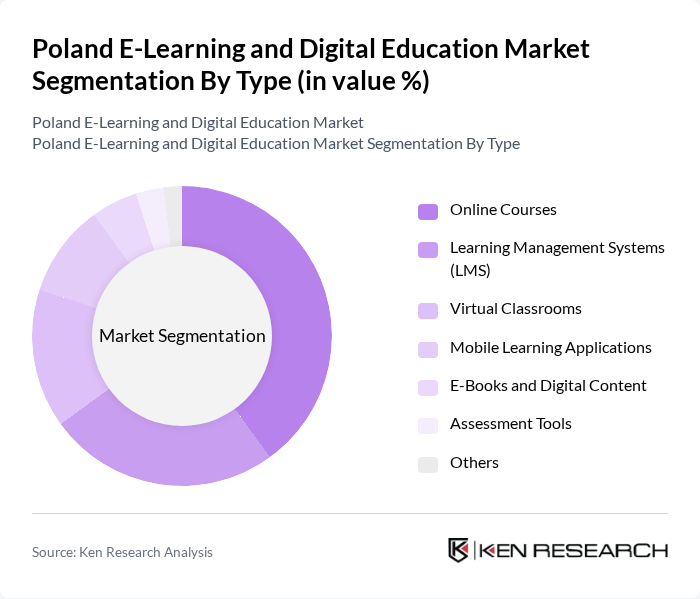
By Type:The market is segmented into various types, including Online Courses, Learning Management Systems (LMS), Virtual Classrooms, Mobile Learning Applications, E-Books and Digital Content, Assessment Tools, and Others. Among these, Online Courses have emerged as the leading sub-segment due to their accessibility and the growing trend of self-paced learning. The demand for flexible learning solutions has significantly increased, particularly in the wake of the COVID-19 pandemic, which accelerated the shift towards online education.
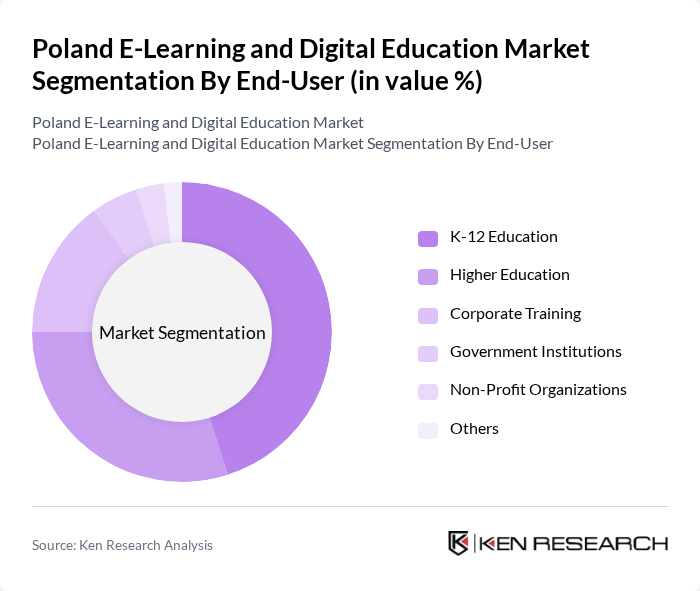
By End-User:The market is categorized by end-users, including K-12 Education, Higher Education, Corporate Training, Government Institutions, Non-Profit Organizations, and Others. The K-12 Education segment is currently the most significant contributor to the market, driven by the increasing integration of technology in classrooms and the growing emphasis on digital literacy among younger generations. Schools are increasingly adopting e-learning platforms to enhance student engagement and learning outcomes.
Poland E-Learning and Digital Education Market Competitive Landscape
The Poland E-Learning and Digital Education Market is characterized by a dynamic mix of regional and international players. Leading participants such as Edukacja Online, eTutor, FutureLearn, Coursera, Udemy, Skillshare, Khan Academy, LinkedIn Learning, OpenClassrooms, Pluralsight, LearnDash, Moodle, TalentLMS, Blackboard, Google Classroom contribute to innovation, geographic expansion, and service delivery in this space.
Poland E-Learning and Digital Education Market Industry Analysis
Growth Drivers
- Increasing Internet Penetration:As of future, Poland's internet penetration rate is projected to reach 92%, with approximately 38 million users accessing online content. This growth is driven by investments in infrastructure, particularly in urban areas, where 98% of households have internet access. Enhanced connectivity facilitates the adoption of e-learning platforms, enabling educational institutions to reach a broader audience and provide diverse learning resources, thus driving market expansion.
- Demand for Flexible Learning Solutions:The Polish education sector is witnessing a significant shift towards flexible learning solutions, with over 65% of students expressing a preference for online courses. This trend is supported by the increasing number of working professionals seeking to upskill while balancing job responsibilities. The rise in demand for asynchronous learning options is prompting educational providers to innovate and diversify their offerings, thereby enhancing market growth.
- Government Initiatives for Digital Education:The Polish government has allocated approximately €250 million for digital education initiatives in future, aiming to enhance the quality of online learning. This funding supports the development of digital resources, teacher training programs, and infrastructure improvements. Such initiatives are crucial in promoting e-learning adoption across various educational levels, thereby fostering a more inclusive and technologically advanced educational landscape.
Market Challenges
- High Competition Among Providers:The e-learning market in Poland is characterized by intense competition, with over 600 registered providers vying for market share. This saturation leads to price wars and challenges in differentiating offerings. As a result, many providers struggle to maintain profitability while ensuring high-quality content and user engagement, which can hinder overall market growth and innovation.
- Resistance to Change in Traditional Education Systems:Despite the growth of e-learning, many traditional educational institutions in Poland remain resistant to adopting digital solutions. Approximately 45% of educators express concerns about the effectiveness of online learning compared to traditional methods. This resistance can slow the integration of digital education, limiting the potential for innovation and the expansion of e-learning platforms in the market.
Poland E-Learning and Digital Education Market Future Outlook
The future of the e-learning market in Poland appears promising, driven by technological advancements and changing educational paradigms. The integration of artificial intelligence and personalized learning experiences is expected to enhance student engagement and outcomes. Additionally, the focus on lifelong learning will encourage continuous skill development, particularly in the corporate sector, fostering a culture of adaptability and innovation within the educational landscape.
Market Opportunities
- Growth in Corporate E-Learning:The corporate e-learning sector in Poland is projected to grow significantly, with companies investing over €200 million in employee training programs in future. This trend presents opportunities for e-learning providers to develop tailored solutions that meet the specific needs of businesses, enhancing workforce skills and productivity.
- Expansion of Gamification in Learning:The incorporation of gamification in e-learning is gaining traction, with an estimated 35% of educational platforms adopting game-based elements by future. This approach not only increases engagement but also improves knowledge retention, creating a lucrative opportunity for developers to innovate and attract a younger audience seeking interactive learning experiences.
Scope of the Report
| Segment | Sub-Segments |
|---|---|
| By Type | Online Courses Learning Management Systems (LMS) Virtual Classrooms Mobile Learning Applications E-Books and Digital Content Assessment Tools Others |
| By End-User | K-12 Education Higher Education Corporate Training Government Institutions Non-Profit Organizations Others |
| By Application | Skill Development Professional Certification Language Learning Compliance Training Others |
| By Delivery Mode | Synchronous Learning Asynchronous Learning Blended Learning Others |
| By Pricing Model | Subscription-Based Pay-Per-Course Freemium Model Others |
| By Content Type | Video Content Textual Content Interactive Content Others |
| By Region | Central Poland Northern Poland Southern Poland Eastern Poland Western Poland Others |
Key Target Audience
Investors and Venture Capitalist Firms
Government and Regulatory Bodies (e.g., Ministry of Education, Ministry of Digital Affairs)
Corporate Training and Development Departments
Content Developers and Course Creators
Technology Providers and Software Developers
Telecommunications Companies
Non-Governmental Organizations (NGOs) focused on education
Educational Technology Startups
Players Mentioned in the Report:
Edukacja Online
eTutor
FutureLearn
Coursera
Udemy
Skillshare
Khan Academy
LinkedIn Learning
OpenClassrooms
Pluralsight
LearnDash
Moodle
TalentLMS
Blackboard
Google Classroom
Table of Contents
Market Assessment Phase
1. Executive Summary and Approach
2. Poland E-Learning and Digital Education Market Overview
2.1 Key Insights and Strategic Recommendations
2.2 Poland E-Learning and Digital Education Market Overview
2.3 Definition and Scope
2.4 Evolution of Market Ecosystem
2.5 Timeline of Key Regulatory Milestones
2.6 Value Chain & Stakeholder Mapping
2.7 Business Cycle Analysis
2.8 Policy & Incentive Landscape
3. Poland E-Learning and Digital Education Market Analysis
3.1 Growth Drivers
3.1.1 Increasing Internet Penetration
3.1.2 Demand for Flexible Learning Solutions
3.1.3 Government Initiatives for Digital Education
3.1.4 Rise of Mobile Learning Platforms
3.2 Market Challenges
3.2.1 High Competition Among Providers
3.2.2 Resistance to Change in Traditional Education Systems
3.2.3 Digital Divide in Rural Areas
3.2.4 Regulatory Compliance Issues
3.3 Market Opportunities
3.3.1 Growth in Corporate E-Learning
3.3.2 Expansion of Gamification in Learning
3.3.3 Increasing Investment in EdTech Startups
3.3.4 Partnerships with Educational Institutions
3.4 Market Trends
3.4.1 Personalization of Learning Experiences
3.4.2 Integration of AI in Learning Platforms
3.4.3 Focus on Lifelong Learning
3.4.4 Use of Data Analytics for Student Performance
3.5 Government Regulation
3.5.1 Data Protection Regulations
3.5.2 Accreditation Standards for Online Courses
3.5.3 Funding for Digital Education Initiatives
3.5.4 Guidelines for Content Quality Assurance
4. SWOT Analysis
5. Stakeholder Analysis
6. Porter's Five Forces Analysis
7. Poland E-Learning and Digital Education Market Market Size, 2019-2024
7.1 By Value
7.2 By Volume
7.3 By Average Selling Price
8. Poland E-Learning and Digital Education Market Segmentation
8.1 By Type
8.1.1 Online Courses
8.1.2 Learning Management Systems (LMS)
8.1.3 Virtual Classrooms
8.1.4 Mobile Learning Applications
8.1.5 E-Books and Digital Content
8.1.6 Assessment Tools
8.1.7 Others
8.2 By End-User
8.2.1 K-12 Education
8.2.2 Higher Education
8.2.3 Corporate Training
8.2.4 Government Institutions
8.2.5 Non-Profit Organizations
8.2.6 Others
8.3 By Application
8.3.1 Skill Development
8.3.2 Professional Certification
8.3.3 Language Learning
8.3.4 Compliance Training
8.3.5 Others
8.4 By Delivery Mode
8.4.1 Synchronous Learning
8.4.2 Asynchronous Learning
8.4.3 Blended Learning
8.4.4 Others
8.5 By Pricing Model
8.5.1 Subscription-Based
8.5.2 Pay-Per-Course
8.5.3 Freemium Model
8.5.4 Others
8.6 By Content Type
8.6.1 Video Content
8.6.2 Textual Content
8.6.3 Interactive Content
8.6.4 Others
8.7 By Region
8.7.1 Central Poland
8.7.2 Northern Poland
8.7.3 Southern Poland
8.7.4 Eastern Poland
8.7.5 Western Poland
8.7.6 Others
9. Poland E-Learning and Digital Education Market Competitive Analysis
9.1 Market Share of Key Players
9.2 Cross Comparison of Key Players
9.2.1 Company Name
9.2.2 Group Size (Large, Medium, or Small as per industry convention)
9.2.3 Revenue Growth Rate
9.2.4 Customer Acquisition Cost
9.2.5 Customer Retention Rate
9.2.6 Market Penetration Rate
9.2.7 Average Course Completion Rate
9.2.8 Pricing Strategy
9.2.9 User Engagement Metrics
9.2.10 Content Quality Rating
9.3 SWOT Analysis of Top Players
9.4 Pricing Analysis
9.5 Detailed Profile of Major Companies
9.5.1 Edukacja Online
9.5.2 eTutor
9.5.3 FutureLearn
9.5.4 Coursera
9.5.5 Udemy
9.5.6 Skillshare
9.5.7 Khan Academy
9.5.8 LinkedIn Learning
9.5.9 OpenClassrooms
9.5.10 Pluralsight
9.5.11 LearnDash
9.5.12 Moodle
9.5.13 TalentLMS
9.5.14 Blackboard
9.5.15 Google Classroom
10. Poland E-Learning and Digital Education Market End-User Analysis
10.1 Procurement Behavior of Key Ministries
10.1.1 Budget Allocation for Digital Education
10.1.2 Decision-Making Processes
10.1.3 Preferred Vendors and Solutions
10.2 Corporate Spend on Infrastructure & Energy
10.2.1 Investment in E-Learning Platforms
10.2.2 Budget for Employee Training Programs
10.2.3 Spending on Digital Tools and Resources
10.3 Pain Point Analysis by End-User Category
10.3.1 Challenges in Content Accessibility
10.3.2 Issues with User Engagement
10.3.3 Technical Support and Maintenance Needs
10.4 User Readiness for Adoption
10.4.1 Familiarity with Digital Tools
10.4.2 Training Needs Assessment
10.4.3 Attitudes Towards Online Learning
10.5 Post-Deployment ROI and Use Case Expansion
10.5.1 Measurement of Learning Outcomes
10.5.2 Feedback Mechanisms for Improvement
10.5.3 Opportunities for Upselling and Cross-Selling
11. Poland E-Learning and Digital Education Market Future Size, 2025-2030
11.1 By Value
11.2 By Volume
11.3 By Average Selling Price
Go-To-Market Strategy Phase
1. Whitespace Analysis + Business Model Canvas
1.1 Market Gaps Identification
1.2 Value Proposition Development
1.3 Revenue Streams Analysis
1.4 Customer Segmentation
1.5 Key Partnerships
1.6 Cost Structure
1.7 Channels of Distribution
2. Marketing and Positioning Recommendations
2.1 Branding Strategies
2.2 Product USPs
2.3 Target Audience Identification
2.4 Communication Strategies
2.5 Digital Marketing Tactics
3. Distribution Plan
3.1 Urban Retail Strategies
3.2 Rural NGO Tie-Ups
3.3 Online Distribution Channels
3.4 Partnerships with Educational Institutions
4. Channel & Pricing Gaps
4.1 Underserved Routes
4.2 Pricing Bands Analysis
4.3 Competitor Pricing Comparison
5. Unmet Demand & Latent Needs
5.1 Category Gaps
5.2 Consumer Segments Analysis
5.3 Emerging Trends Identification
6. Customer Relationship
6.1 Loyalty Programs
6.2 After-Sales Service
6.3 Customer Feedback Mechanisms
7. Value Proposition
7.1 Sustainability Initiatives
7.2 Integrated Supply Chains
7.3 Unique Selling Points
8. Key Activities
8.1 Regulatory Compliance
8.2 Branding Efforts
8.3 Distribution Setup
9. Entry Strategy Evaluation
9.1 Domestic Market Entry Strategy
9.1.1 Product Mix Considerations
9.1.2 Pricing Band Strategy
9.1.3 Packaging Options
9.2 Export Entry Strategy
9.2.1 Target Countries
9.2.2 Compliance Roadmap
10. Entry Mode Assessment
10.1 Joint Ventures
10.2 Greenfield Investments
10.3 Mergers & Acquisitions
10.4 Distributor Model
11. Capital and Timeline Estimation
11.1 Capital Requirements
11.2 Timelines for Implementation
12. Control vs Risk Trade-Off
12.1 Ownership vs Partnerships
13. Profitability Outlook
13.1 Breakeven Analysis
13.2 Long-Term Sustainability
14. Potential Partner List
14.1 Distributors
14.2 Joint Ventures
14.3 Acquisition Targets
15. Execution Roadmap
15.1 Phased Plan for Market Entry
15.1.1 Market Setup
15.1.2 Market Entry
15.1.3 Growth Acceleration
15.1.4 Scale & Stabilize
15.2 Key Activities and Milestones
15.2.1 Milestone Planning
15.2.2 Activity Tracking
Research Methodology
Phase 1: Approach1
Desk Research
- Analysis of government reports on digital education initiatives in Poland
- Review of industry publications and white papers on e-learning trends
- Examination of statistical data from educational institutions and e-learning platforms
Primary Research
- Interviews with educational policymakers and government officials
- Surveys with e-learning providers and technology vendors
- Focus groups with educators and students to gather qualitative insights
Validation & Triangulation
- Cross-validation of findings through multiple data sources, including academic journals
- Triangulation of insights from primary interviews and secondary data analysis
- Sanity checks conducted with industry experts to ensure data reliability
Phase 2: Market Size Estimation1
Top-down Assessment
- Estimation of total market size based on national education budgets and digital spending
- Segmentation of the market by educational levels (K-12, higher education, corporate training)
- Incorporation of growth rates from government e-learning initiatives and funding
Bottom-up Modeling
- Data collection from leading e-learning platforms on user engagement and revenue
- Estimation of average spending per user across different educational segments
- Volume x cost analysis based on subscription models and course fees
Forecasting & Scenario Analysis
- Multi-factor regression analysis incorporating technology adoption rates and demographic trends
- Scenario modeling based on potential regulatory changes and market disruptions
- Development of baseline, optimistic, and pessimistic forecasts through 2030
Phase 3: CATI Sample Composition1
| Scope Item/Segment | Sample Size | Target Respondent Profiles |
|---|---|---|
| K-12 E-Learning Adoption | 150 | School Administrators, Teachers |
| Higher Education Online Programs | 100 | University Faculty, Program Coordinators |
| Corporate Training Solutions | 80 | HR Managers, Training Coordinators |
| EdTech Startups and Innovations | 70 | Founders, Product Managers |
| Student Engagement in E-Learning | 120 | Students, Educational Consultants |
Frequently Asked Questions
What is the current value of the Poland E-Learning and Digital Education Market?
The Poland E-Learning and Digital Education Market is valued at approximately USD 1.5 billion, reflecting significant growth driven by the increasing adoption of digital learning solutions in educational institutions and corporate training programs.
Which cities are key players in the Poland E-Learning market?
What recent government initiatives have impacted digital education in Poland?
What types of e-learning solutions are most popular in Poland?
Other Regional/Country Reports
Indonesia E-Learning and Digital Education Market
Malaysia E-Learning and Digital Education Market
KSA E-Learning and Digital Education Market
APAC E-Learning and Digital Education Market
SEA E-Learning and Digital Education Market
Vietnam E-Learning and Digital Education Market
Other Adjacent Reports
Germany Educational Technology Market
Japan Learning Management Systems Market
South Africa Online Course Platforms Market
Oman Corporate Training Solutions Market
Brazil Digital Content Delivery Market
Kuwait Mobile Learning Applications Market
South Africa Virtual Classroom Software Market
Egypt Assessment Tools Market
Qatar E-Book and Digital Publishing Market
Japan Gamified Learning Market
Why Buy From Us?

What makes us stand out is that our consultants follow Robust, Refine and Result (RRR) methodology. Robust for clear definitions, approaches and sanity checking, Refine for differentiating respondents' facts and opinions, and Result for presenting data with story.

We have set a benchmark in the industry by offering our clients with syndicated and customized market research reports featuring coverage of entire market as well as meticulous research and analyst insights.

While we don't replace traditional research, we flip the method upside down. Our dual approach of Top Bottom & Bottom Top ensures quality deliverable by not just verifying company fundamentals but also looking at the sector and macroeconomic factors.

With one step in the future, our research team constantly tries to show you the bigger picture. We help with some of the tough questions you may encounter along the way: How is the industry positioned? Best marketing channel? KPI's of competitors? By aligning every element, we help maximize success.

Our report gives you instant access to the answers and sources that other companies might choose to hide. We elaborate each steps of research methodology we have used and showcase you the sample size to earn your trust.

If you need any support, we are here! We pride ourselves on universe strength, data quality, and quick, friendly, and professional service.