CHAPTER 1 - MARKET SUMMARY
Market Overview
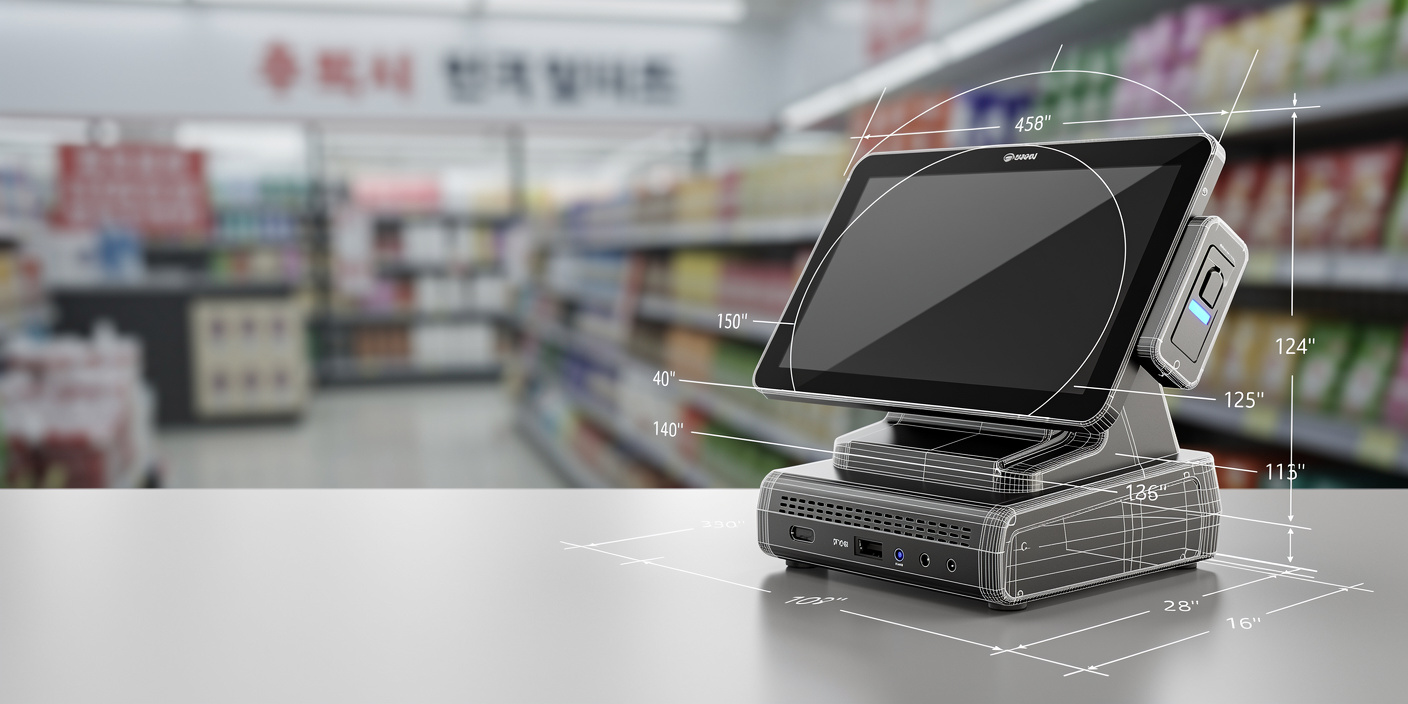
The South Korea POS Terminal Market operates through hardware manufacturers, payment-terminal vendors, value-added network providers, software developers, systems integrators and merchant acquirers. Demand is sustained by an exceptionally transaction-intensive economy: payment cards processed a daily average of 81.06 million transactions in 2024, increasing 3.4% year over year and supporting recurring terminal, maintenance and software requirements.
Demand is concentrated in the Seoul Capital Area, where corporate headquarters, national retail chains, tourism, foodservice and technology providers create high terminal density and rapid upgrade cycles. South Korea recorded 6.35 million business establishments in 2024, while wholesale and retail accounted for approximately 1.61 million establishments and accommodation and foodservice represented about 858,000.
Market Value
USD 2.30 billion
2025
Dominant Region
Seoul Capital Area
Dominant Segment
Fixed POS Systems
Total Number of Players
75
Future Outlook
The South Korea POS Terminal Market is projected to increase from USD 2.30 billion in 2025 to USD 3.65 billion by 2031. The resulting 8.00% forecast CAGR exceeds the 6.74% historical CAGR recorded during 2020-2025. Growth will be supported by merchant digitization, cloud-connected POS deployment, Android-based smart terminals, recurring software subscriptions and rising investment in self-service checkout across retail, restaurants, transport, healthcare and tourism-facing establishments.
Value growth is expected to outpace installed-terminal growth because an increasing proportion of revenue will come from software licenses, device-management subscriptions, payment connectivity, data analytics, managed support and integrated peripherals. The active installed base is modeled to expand from 5.25 million terminal equivalents in 2025 to 6.75 million in 2031, representing a 4.28% volume CAGR. The remaining growth reflects product mix, service attachment and recurring-revenue expansion.
CHAPTER 2 - SCOPE OF REPORT
Scope of the Market
CHAPTER 3 - Key Stakeholders
Key Target Audience
Key stakeholders who can leverage this market analysis for investment, strategy and operational planning.
Investors
CAGR, recurring revenue, cash conversion, churn, valuation, risk
Corporates
checkout speed, integration cost, uptime, analytics, merchant experience
Government
payment resilience, security, accessibility, compliance, digital inclusion
Operators
installed base, service cost, transaction throughput, device availability
Financial institutions
merchant acquisition, settlement risk, fraud, transaction growth, creditworthiness
CHAPTER 4 - Market Size & Growth
Market Size, Growth Forecast and Trends
This section evaluates historical market size, analyzes year-over-year growth dynamics and presents forecast projections supported by merchant activity, payment-system usage, installed-terminal expansion, recurring software adoption and service-revenue development.
Historical & Projected Market Size ($ Million)
Year-over-Year Growth Rate (%)
Market Value vs Volume Growth (%)
Historical Market Performance (2020-2025)
Market value increased by USD 640 million between 2020 and 2025. Growth accelerated from 5.4% in 2021 to 7.5% in 2025 as merchants resumed capital expenditure, restaurants expanded digital ordering and terminal vendors attached more software and maintenance revenue. The active installed base increased from 4.35 million to 5.25 million terminal equivalents, while annual deployments rose from approximately 980,000 to 1.52 million units.
Forecast Market Outlook (2026-2031)
The market is forecast to add USD 1.35 billion between 2025 and 2031. Annual growth remains near 8% because cloud POS, managed devices, Android smart terminals and unattended checkout increase revenue per merchant. The installed base is projected to reach 6.75 million terminal equivalents, while annual deployments reach 2.57 million units. Recurring software and service attachment will be the main reason value growth exceeds volume growth.
CHAPTER 5 - Market Data
Market Breakdown
The detailed operating model indicates a transition from replacement-led hardware revenue toward connected devices, software subscriptions and managed-service economics. For CEOs and investors, cloud-connected share and installed-base monetization are more informative than unit shipments alone.
Year | Market Size (USD Mn) | YoY Growth (%) | Active Installed Base (Mn Units) | Cloud-Connected Share (%) | Annual Deployments (000 Units) | Period |
|---|---|---|---|---|---|---|
| 2020 | $1,660 Mn | +- | 4.35 | 18% | Forecast | |
| 2021 | $1,750 Mn | +5.4% | 4.48 | 22% | Forecast | |
| 2022 | $1,870 Mn | +6.9% | 4.66 | 27% | Forecast | |
| 2023 | $2,000 Mn | +7.0% | 4.86 | 33% | Forecast | |
| 2024 | $2,140 Mn | +7.0% | 5.05 | 38% | Forecast | |
| 2025 | $2,300 Mn | +7.5% | 5.25 | 43% | Forecast | |
| 2026F | $2,480 Mn | +7.8% | 5.49 | 49% | Forecast | |
| 2027F | $2,680 Mn | +8.1% | 5.74 | 55% | Forecast | |
| 2028F | $2,895 Mn | +8.0% | 5.99 | 60% | Forecast | |
| 2029F | $3,130 Mn | +8.1% | 6.25 | 64% | Forecast | |
| 2030F | $3,380 Mn | +8.0% | 6.51 | 68% | Forecast | |
| 2031F | $3,650 Mn | +8.0% | 6.75 | 71% | Forecast |
Active Installed Base
5.25 million units, 2025, South Korea. Scale supports recurring maintenance, payment connectivity and software revenue. South Korea had 6.35 million business establishments in 2024, providing a broad merchant universe.
Cloud-Connected Share
43%, 2025, South Korea. Cloud migration improves remote support, feature deployment and multisite reporting. Easy-payment volume reached 30.72 million daily transactions in 2024, reinforcing the need for connected payment orchestration.
Annual Deployments
1.52 million units, 2025, South Korea. Deployments include replacements, new merchant installations and self-service equipment. Device-present payment value using mobile devices or computers grew 10.7% in 2024.
CHAPTER 6 - Segmentation
Market Segmentation Framework
The segmentation framework classifies the South Korea POS Terminal Market as technology-led. The selected dimensions distinguish product architecture, deployment economics, merchant requirements, commercial models and geographic demand concentration.
Solution Type
Deployment Model
End-Use Industry
Enterprise Size
Application
Pricing Model
Geography
Key Segmentation Takeaways
Comprehensive analysis across all extracted segmentation dimensions provides insights into market structure, merchant preferences, operating requirements and distribution patterns.
Fixed POS Systems
Fixed systems remain dominant because national retailers, supermarkets, department stores, franchise networks and high-throughput restaurants require durable checkout hardware, peripheral integration and reliable local processing. All-in-one touch POS terminals are the largest Level-2 configuration, supported by standardized store formats, predictable replacement cycles and established integration with barcode scanners, printers, cash drawers and payment terminals.
Mobile and Handheld POS
Mobile and handheld systems are the fastest-growing segment as restaurants move ordering and payment to the table, retailers deploy queue-busting tools and small merchants seek lower installation costs. Rugged Android handheld terminals are the fastest-growing Level-2 sub-segment because they combine payment acceptance, inventory lookup, order management and staff mobility on one device.
CHAPTER 7 - Regional Analysis
Regional Analysis
South Korea is compared with adjacent and economically relevant Asia-Pacific markets using a harmonized terminal-market scope covering commercial POS hardware, software, integration, maintenance and managed merchant solutions.
Focus Country Ranking:
Focus Country Market Size:
Focus Country CAGR:
Focus Country Ranking:
Focus Country Market Size:
Focus Country CAGR:
Regional Analysis (Current Year)
Market Position
South Korea ranks third within the selected peer group, combining a USD 2.30 billion market with 5.25 million active terminal equivalents and one of Asia's highest card-payment usage intensities.
Growth Advantage
South Korea's 8.00% forecast CAGR exceeds the selected peer average of approximately 7.82%, supported by mobile-device payment growth, smart-terminal replacement and merchant demand for integrated software.
Competitive Strengths
Competitive advantages include 81.06 million daily card transactions, 30.72 million daily easy-payment transactions and a domestic POS manufacturing ecosystem serving fixed, mobile, kiosk and printer categories.
CHAPTER 8 - INDUSTRY ANALYSIS
Growth Drivers, Challenges and Opportunities
Comprehensive analysis of key factors shaping the South Korea POS Terminal Market, including growth catalysts, operational challenges and emerging opportunities across production, distribution and merchant segments.
Growth Drivers
Expanding Addressable Merchant Base
- Wholesale and retail represented approximately 1.61 million establishments (2024, South Korea), supporting high-volume demand for checkout terminals, printers, scanners and inventory-integrated POS software.
- Accommodation and foodservice included approximately 858,000 establishments (2024, South Korea), creating recurring demand for restaurant POS, ordering kiosks, kitchen-display integration and tableside payment.
- Businesses with one to four employees increased by approximately 152,000 establishments (2024, South Korea), expanding the addressable base for low-cost subscription POS and bundled merchant services.
High Card and Mobile-Payment Intensity
- Daily payment-card value reached KRW 3.60 trillion in 2024, increasing 3.9% and supporting investment in resilient hardware, network redundancy and transaction monitoring.
- Device-present payment value using mobile devices or computers increased 10.7% in 2024, accelerating NFC, QR, wallet and smart-terminal upgrades.
- Easy-payment services processed 30.72 million daily transactions in 2024, up 12.3%, increasing demand for wallet orchestration and tokenized card acceptance.
Omnichannel Retail and Service Digitization
- Mobile shopping accounted for 76.4% of online transaction value in December 2024, reinforcing demand for mobile-first merchant interfaces and unified customer records.
- Online food-service transaction value increased 17.5% year over year in December 2024, supporting restaurant POS integration with delivery, pickup and kitchen workflows.
- South Korea welcomed approximately 16.37 million international visitors in 2024, increasing demand for multilingual interfaces, foreign cards, digital wallets and tax-refund integration.
Market Challenges
Merchant Budget Pressure and Hardware Commoditization
- One-to-four-person establishments expanded by 2.8% in 2024, but their limited capital budgets increase demand for low upfront prices and compress vendor hardware margins.
- Device-present payments using physical cards declined 2.3% in value during 2024, reducing the strategic value of terminals that cannot support wallets or alternative payments.
- Prepaid-card payment value declined 28.7% in 2024, illustrating how payment-method shifts can shorten product relevance and strand single-purpose terminal investments.
Security, Certification and Regulatory Complexity
- Payment-terminal vendors commonly require at least 2 EMV certification layers, Level 1 and Level 2, before card-network deployment, extending product-development and recertification cycles.
- The Bank of Korea's 2024 program included preparation for ISO 20022 adoption, requiring processors and connected vendors to update message standards, testing and data mapping.
- The TMON-WeMakePrice event prompted additional payment-gateway supervision during 2024-2025, increasing expectations for settlement controls, merchant monitoring and consumer-protection evidence.
Fragmented Integration and Legacy Installed Base
- Account transfers reached 43.53 million daily transactions in 2024, adding alternative-payment workflows that POS platforms must reconcile with card-based sales and refunds.
- Internet-banking subscriptions reached 241.86 million registrations in 2024, including duplicate customers, increasing expectations for real-time account, wallet and merchant-service interoperability.
- Easy payments represented 51.1% of card payments made through mobile devices or computers in 2024, creating integration pressure for legacy POS estates.
Market Opportunities
Cloud POS Subscriptions for Small Merchants
- Converting only 5% of establishments into managed subscription customers would create more than 317,000 potential merchant accounts for software and device services.
- POS vendors, VAN providers, software developers and channel partners gain recurring revenue from the 2.8% expansion in one-to-four-person establishments during 2024.
- Suppliers need automated onboarding, remote support and transparent packages as merchant numbers increased by 107,184 businesses in 2024.
Self-Service Kiosks and Smart Store Automation
- Kiosk hardware, software, payment modules and support can produce multi-component contracts as online food-service value increased 17.5% in December 2024.
- Restaurants, convenience stores, transport operators and tourism venues gain labor productivity while serving 16.37 million international visitors recorded in 2024.
- Vendors must improve accessibility, multilingual design and wallet support as device-present mobile payment value increased 10.7% in 2024.
Wallet, Loyalty and Cross-Border Payment Integration
- Vendors can attach loyalty, coupons, tax refunds and customer analytics to 30.72 million daily easy-payment transactions.
- Retailers, hospitality operators and wallet providers can target 16.37 million foreign visitors recorded in 2024 with multilingual and currency-aware checkout.
- Open APIs, tokenized credentials and standardized messages are required as the Bank of Korea prepares ISO 20022 and cross-border payment enhancements.
CHAPTER 9 - Competitive Landscape
Competitive Landscape Overview
The South Korea POS Terminal Market is moderately fragmented across domestic manufacturers, payment-terminal specialists and international retail-technology vendors. Product certification, distribution relationships, installed merchant bases, service coverage and software integration create meaningful entry barriers.
Market Share Distribution
Top 5 Players
Market Dynamics
8 new entrants in the past 5 years, indicating strong market attractiveness and growth potential.
Company Name | Market Share | Headquarters | Founding Year | Core Market Focus |
|---|---|---|---|---|
POSBANK Co., Ltd. | - | Seoul, South Korea | 1994 | All-in-one POS terminals, kiosks, printers and retail peripherals |
Toshiba Global Commerce Solutions | - | Durham, United States | 2012 | Enterprise retail checkout, self-checkout and commerce software |
HANASIS Co., Ltd. | - | Suwon, South Korea | 2005 | POS systems, kiosks, kitchen displays and smart vending equipment |
SAM4S | - | Seoul, South Korea | - | POS terminals, self-service kiosks, receipt printers and cash registers |
BIXOLON Co., Ltd. | - | Seongnam, South Korea | 2002 | POS, mobile and label printers for retail and hospitality |
Fujitsu Korea Limited | - | Seoul, South Korea | - | Enterprise retail systems, store infrastructure and integration |
Hwasung System Co., Ltd. | - | South Korea | - | Kiosk, ticketing and POS thermal-printer solutions |
Kwangwoo Information & Communication Co., Ltd. | - | Anyang, South Korea | 1997 | EFT-POS terminals, smart-card solutions and unattended payments |
Bluebird Inc. | - | Seoul, South Korea | 1995 | Enterprise mobile computers and payment-enabled handheld devices |
EES Corp Co., Ltd. | - | South Korea | - | POS hardware, payment peripherals and customized merchant equipment |
Cross Comparison Parameters
The report provides detailed cross-comparison of key players across 10 performance parameters to identify competitive strengths and weaknesses.
Analysis Covered
Market Share Analysis:
Compares estimated vendor scale across hardware and software categories
Cross Comparison Matrix:
Benchmarks installed base, channels, technology and financial performance
SWOT Analysis:
Identifies company-specific capabilities, gaps, risks and expansion options
Pricing Strategy Analysis:
Evaluates purchase, lease, subscription and transaction-linked commercial models
Company Profiles:
Reviews product focus, geographic presence and strategic positioning
CHAPTER 10 - REPORT TOC
Market Report Structure
Comprehensive coverage across three strategic phases — Market Assessment, Go-To-Market Strategy, and Survey — delivering end-to-end insights from market analysis and execution roadmap to customer demand validation.
Market Assessment Phase
Supply-side and competitive intelligence covering market sizing, segmentation, competitive dynamics, regulatory landscape, and future forecasts.
Go-To-Market Strategy Phase
15 chapters
Entry strategy evaluation, execution roadmap, partner recommendations, and profitability outlook.
Survey Phase
8 chapters
Demand-side primary research conducted through structured interviews and online surveys with end users across priority metros and Tier 2/3 cities to capture consumption behavior, unmet needs, and purchase drivers.
Complete Report Coverage
201+ detailed sections covering every aspect of the market
143
Assessment Sections
58
Strategy Sections
CHAPTER 11 - Our Approach
Research Methodology
Desk Research
- Reviewed national payment-system transaction statistics
- Mapped merchant establishments by industry
- Assessed terminal vendors and products
- Tracked regulations and payment standards
Primary Research
- Interviewed merchant-acquiring strategy directors
- Consulted POS product management leaders
- Engaged retail technology procurement managers
- Surveyed restaurant operations technology heads
Validation and Triangulation
- Validated findings across 304 respondents
- Reconciled vendor and merchant estimates
- Compared shipments with installed base
- Stress-tested pricing and service attachment
CHAPTER 12 - FAQ
Market Entry Prioritization
Still have questions?
Our research team is here to help you find the right solution
CHAPTER 13 - Related Research
Explore Related Reports
Expand your market intelligence with complementary research across regions and adjacent markets.
Regional/Country ReportsRelated market analysis across key regions
Related market analysis across key regions
- Indonesia POS Terminal Market
- Vietnam POS Terminal Market
- Thailand POS Terminal Market
- Malaysia POS Terminal Market
- Philippines POS Terminal Market
Adjacent ReportsRelated markets and complementary research
Related markets and complementary research
- Oman Mobile Payment Processing Market
- UAE Digital Wallet Market
- Singapore Cloud-Connected Commerce Market
- Germany Point-of-Sale System Market
- Global Self-Service Kiosk Market Size, Share & Forecast, By Product Type, Component, End-Use Industry & Region, 2026-2031
500+
Market Research Reports
50+
Countries Covered
15+
Industry Verticals