About the Report
Base Year 2024Australia Online Grocery and Quick Commerce Market Overview
- The Australia Online Grocery and Quick Commerce Market is valued at USD 5 billion, based on a five-year historical analysis. This growth is primarily driven by the increasing adoption of digital platforms for grocery shopping, coupled with changing consumer preferences towards convenience and time-saving solutions. The rise in smartphone penetration and improved internet connectivity have further accelerated the shift towards online grocery shopping.
- Key cities dominating this market include Sydney, Melbourne, and Brisbane. These urban centers benefit from a high population density, diverse demographics, and a strong infrastructure that supports efficient logistics and delivery systems. The concentration of tech-savvy consumers in these cities also drives demand for online grocery services, making them pivotal in the market landscape.
- In 2023, the Australian government implemented regulations to enhance food safety standards in online grocery sales. This includes mandatory compliance with the Food Standards Australia New Zealand (FSANZ) guidelines, ensuring that all online grocery retailers adhere to strict hygiene and safety protocols. Such regulations aim to protect consumers and maintain the integrity of food products sold online.

Australia Online Grocery and Quick Commerce Market Segmentation
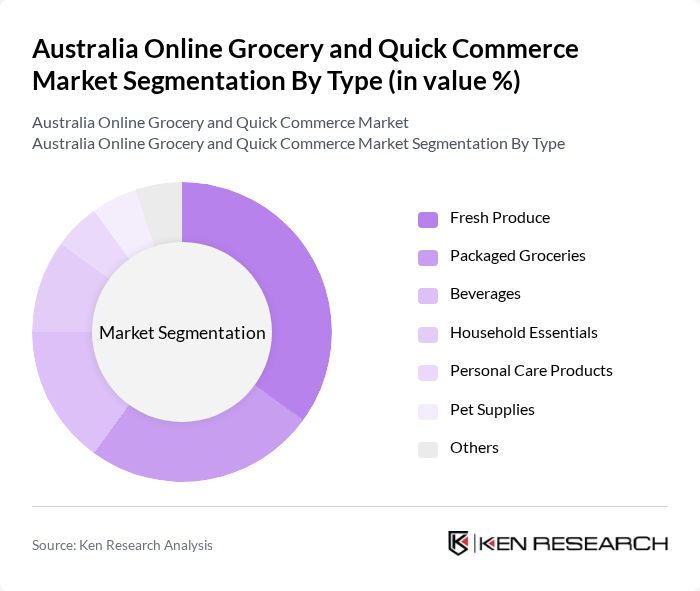
By Type:The market is segmented into various types, including Fresh Produce, Packaged Groceries, Beverages, Household Essentials, Personal Care Products, Pet Supplies, and Others. Among these, Fresh Produce is currently the leading sub-segment, driven by the increasing consumer preference for fresh and organic food options. The demand for healthy eating habits has surged, leading to a significant rise in online purchases of fruits, vegetables, and other perishable goods.
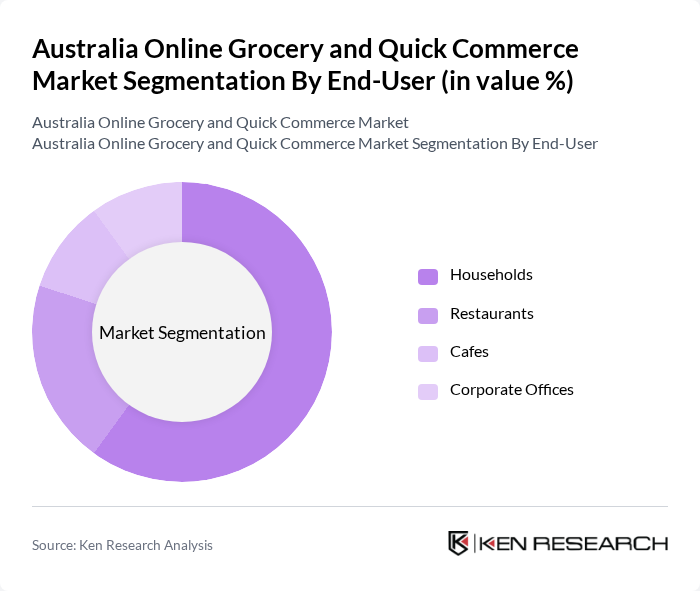
By End-User:The end-user segmentation includes Households, Restaurants, Cafes, and Corporate Offices. Households represent the largest segment, as the convenience of online grocery shopping appeals to busy families and individuals. The trend of cooking at home has gained momentum, especially post-pandemic, leading to increased online grocery orders from households seeking to stock up on essentials.
Australia Online Grocery and Quick Commerce Market Competitive Landscape
The Australia Online Grocery and Quick Commerce Market is characterized by a dynamic mix of regional and international players. Leading participants such as Woolworths Group Limited, Coles Group Limited, Aldi Stores Australia, IGA (Independent Grocers of Australia), Amazon Australia, HelloFresh SE, Menulog, Uber Eats, DoorDash, Harris Farm Markets, Costco Wholesale Australia, Foodora, FreshDirect, Sendle, Youfoodz contribute to innovation, geographic expansion, and service delivery in this space.
Australia Online Grocery and Quick Commerce Market Industry Analysis
Growth Drivers
- Increasing Consumer Demand for Convenience:The Australian online grocery market is experiencing a surge in consumer demand for convenience, with 60% of Australians preferring online shopping for groceries. This shift is driven by busy lifestyles, with 45% of consumers indicating they value time-saving solutions. The convenience factor is further supported by the Australian Bureau of Statistics reporting a 15% increase in online retail sales in the future, highlighting a growing trend towards digital shopping platforms.
- Rise of Mobile Shopping:Mobile shopping is rapidly transforming the Australian grocery landscape, with 50% of online grocery purchases made via mobile devices in the future. The Australian Communications and Media Authority reported that 85% of Australians own smartphones, facilitating easy access to grocery apps. This trend is expected to continue, as mobile commerce is projected to account for 30% of total e-commerce sales in the future, further driving the online grocery market's growth.
- Expansion of Delivery Services:The expansion of delivery services is a significant growth driver in the Australian online grocery market. In the future, the number of grocery delivery services is expected to increase by 25%, with major players like Coles and Woolworths enhancing their logistics capabilities. According to IBISWorld, the grocery delivery segment is expected to generate $1.5 billion in revenue in the future, reflecting the increasing consumer preference for home delivery options and the convenience they provide.
Market Challenges
- Intense Competition:The Australian online grocery market faces intense competition, with over 50 players vying for market share. Major retailers like Coles and Woolworths dominate, but new entrants are emerging, increasing pressure on pricing and service quality. According to MarketLine, the competitive landscape is expected to intensify, with smaller players capturing 20% of the market in the future, challenging established brands to innovate and differentiate their offerings.
- Supply Chain Disruptions:Supply chain disruptions pose a significant challenge to the online grocery sector in Australia. The COVID-19 pandemic highlighted vulnerabilities, with 40% of retailers reporting delays in product availability in the future. The Australian Logistics Council noted that logistics costs have risen by 10% due to increased demand and supply chain inefficiencies. These disruptions can lead to stock shortages, impacting customer satisfaction and overall market growth.
Australia Online Grocery and Quick Commerce Market Future Outlook
The future of the Australian online grocery and quick commerce market appears promising, driven by technological advancements and evolving consumer preferences. As more Australians embrace digital shopping, the integration of AI and machine learning will enhance personalized shopping experiences. Additionally, sustainability initiatives are expected to gain traction, with consumers increasingly favoring eco-friendly practices. The market is likely to see further innovations in delivery methods, including drone deliveries, which could revolutionize the logistics landscape in the future.
Market Opportunities
- Growth of Subscription Services:Subscription services present a lucrative opportunity in the Australian online grocery market. With 30% of consumers expressing interest in subscription models for regular grocery deliveries, companies can capitalize on this trend. This model not only ensures customer loyalty but also stabilizes revenue streams, making it an attractive option for retailers looking to enhance their market presence.
- Expansion into Rural Areas:Expanding into rural areas offers significant growth potential for online grocery retailers. Approximately 25% of Australians living in rural regions have limited access to grocery stores, creating a demand for online solutions. By targeting these underserved markets, companies can tap into a new customer base, driving sales and enhancing service accessibility across the country.
Scope of the Report
| Segment | Sub-Segments |
|---|---|
| By Type | Fresh Produce Packaged Groceries Beverages Household Essentials Personal Care Products Pet Supplies Others |
| By End-User | Households Restaurants Cafes Corporate Offices |
| By Sales Channel | Direct-to-Consumer Third-Party Platforms Subscription Services |
| By Distribution Mode | Home Delivery Click and Collect In-Store Pickup |
| By Price Range | Budget Mid-Range Premium |
| By Product Origin | Local Products Imported Products |
| By Consumer Demographics | Age Group Income Level Family Size |
Key Target Audience
Investors and Venture Capitalist Firms
Government and Regulatory Bodies (e.g., Australian Competition and Consumer Commission, Food Standards Australia New Zealand)
Manufacturers and Producers
Distributors and Retailers
Logistics and Delivery Service Providers
Technology Providers
Industry Associations (e.g., Australian Food and Grocery Council)
Financial Institutions
Players Mentioned in the Report:
Woolworths Group Limited
Coles Group Limited
Aldi Stores Australia
IGA (Independent Grocers of Australia)
Amazon Australia
HelloFresh SE
Menulog
Uber Eats
DoorDash
Harris Farm Markets
Costco Wholesale Australia
Foodora
FreshDirect
Sendle
Youfoodz
Table of Contents
Market Assessment Phase
1. Executive Summary and Approach
2. Australia Online Grocery and Quick Commerce Market Overview
2.1 Key Insights and Strategic Recommendations
2.2 Australia Online Grocery and Quick Commerce Market Overview
2.3 Definition and Scope
2.4 Evolution of Market Ecosystem
2.5 Timeline of Key Regulatory Milestones
2.6 Value Chain & Stakeholder Mapping
2.7 Business Cycle Analysis
2.8 Policy & Incentive Landscape
3. Australia Online Grocery and Quick Commerce Market Analysis
3.1 Growth Drivers
3.1.1 Increasing Consumer Demand for Convenience
3.1.2 Rise of Mobile Shopping
3.1.3 Expansion of Delivery Services
3.1.4 Technological Advancements in Logistics
3.2 Market Challenges
3.2.1 Intense Competition
3.2.2 Supply Chain Disruptions
3.2.3 Regulatory Compliance Issues
3.2.4 Consumer Trust and Data Privacy Concerns
3.3 Market Opportunities
3.3.1 Growth of Subscription Services
3.3.2 Expansion into Rural Areas
3.3.3 Partnerships with Local Producers
3.3.4 Innovations in Payment Solutions
3.4 Market Trends
3.4.1 Increased Focus on Sustainability
3.4.2 Personalization of Shopping Experiences
3.4.3 Integration of AI and Machine Learning
3.4.4 Growth of Social Commerce
3.5 Government Regulation
3.5.1 Food Safety Regulations
3.5.2 E-commerce Taxation Policies
3.5.3 Consumer Protection Laws
3.5.4 Data Privacy Regulations
4. SWOT Analysis
5. Stakeholder Analysis
6. Porter's Five Forces Analysis
7. Australia Online Grocery and Quick Commerce Market Market Size, 2019-2024
7.1 By Value
7.2 By Volume
7.3 By Average Selling Price
8. Australia Online Grocery and Quick Commerce Market Segmentation
8.1 By Type
8.1.1 Fresh Produce
8.1.2 Packaged Groceries
8.1.3 Beverages
8.1.4 Household Essentials
8.1.5 Personal Care Products
8.1.6 Pet Supplies
8.1.7 Others
8.2 By End-User
8.2.1 Households
8.2.2 Restaurants
8.2.3 Cafes
8.2.4 Corporate Offices
8.3 By Sales Channel
8.3.1 Direct-to-Consumer
8.3.2 Third-Party Platforms
8.3.3 Subscription Services
8.4 By Distribution Mode
8.4.1 Home Delivery
8.4.2 Click and Collect
8.4.3 In-Store Pickup
8.5 By Price Range
8.5.1 Budget
8.5.2 Mid-Range
8.5.3 Premium
8.6 By Product Origin
8.6.1 Local Products
8.6.2 Imported Products
8.7 By Consumer Demographics
8.7.1 Age Group
8.7.2 Income Level
8.7.3 Family Size
9. Australia Online Grocery and Quick Commerce Market Competitive Analysis
9.1 Market Share of Key Players
9.2 Cross Comparison of Key Players
9.2.1 Company Name
9.2.2 Group Size (Large, Medium, or Small as per industry convention)
9.2.3 Customer Acquisition Cost
9.2.4 Average Order Value
9.2.5 Customer Retention Rate
9.2.6 Delivery Time Efficiency
9.2.7 Pricing Strategy
9.2.8 Market Penetration Rate
9.2.9 Return on Marketing Investment (ROMI)
9.2.10 Customer Satisfaction Score
9.3 SWOT Analysis of Top Players
9.4 Pricing Analysis
9.5 Detailed Profile of Major Companies
9.5.1 Woolworths Group Limited
9.5.2 Coles Group Limited
9.5.3 Aldi Stores Australia
9.5.4 IGA (Independent Grocers of Australia)
9.5.5 Amazon Australia
9.5.6 HelloFresh SE
9.5.7 Menulog
9.5.8 Uber Eats
9.5.9 DoorDash
9.5.10 Harris Farm Markets
9.5.11 Costco Wholesale Australia
9.5.12 Foodora
9.5.13 FreshDirect
9.5.14 Sendle
9.5.15 Youfoodz
10. Australia Online Grocery and Quick Commerce Market End-User Analysis
10.1 Procurement Behavior of Key Ministries
10.1.1 Government Procurement Policies
10.1.2 Budget Allocations for Food Supplies
10.1.3 Supplier Selection Criteria
10.2 Corporate Spend on Infrastructure & Energy
10.2.1 Investment in Logistics Infrastructure
10.2.2 Energy Efficiency Initiatives
10.2.3 Technology Upgrades
10.3 Pain Point Analysis by End-User Category
10.3.1 Supply Chain Inefficiencies
10.3.2 Quality Control Issues
10.3.3 Pricing Fluctuations
10.4 User Readiness for Adoption
10.4.1 Awareness of Online Grocery Options
10.4.2 Comfort with Digital Payment Methods
10.4.3 Accessibility of Technology
10.5 Post-Deployment ROI and Use Case Expansion
10.5.1 Measurement of Cost Savings
10.5.2 Customer Feedback Mechanisms
10.5.3 Opportunities for Service Expansion
11. Australia Online Grocery and Quick Commerce Market Future Size, 2025-2030
11.1 By Value
11.2 By Volume
11.3 By Average Selling Price
Go-To-Market Strategy Phase
1. Whitespace Analysis + Business Model Canvas
1.1 Market Gaps Identification
1.2 Value Proposition Development
1.3 Revenue Streams Analysis
1.4 Cost Structure Evaluation
1.5 Key Partnerships Exploration
1.6 Customer Segmentation
1.7 Channels of Distribution
2. Marketing and Positioning Recommendations
2.1 Branding Strategies
2.2 Product USPs
2.3 Target Audience Identification
2.4 Communication Strategies
2.5 Digital Marketing Approaches
2.6 Customer Engagement Tactics
3. Distribution Plan
3.1 Urban Retail Strategies
3.2 Rural NGO Tie-Ups
3.3 Logistics Optimization
3.4 Inventory Management Solutions
3.5 Distribution Partnerships
4. Channel & Pricing Gaps
4.1 Underserved Routes
4.2 Pricing Bands Analysis
4.3 Competitor Pricing Strategies
4.4 Consumer Price Sensitivity
5. Unmet Demand & Latent Needs
5.1 Category Gaps Identification
5.2 Consumer Segments Analysis
5.3 Emerging Trends Exploration
5.4 Feedback Collection Mechanisms
6. Customer Relationship
6.1 Loyalty Programs
6.2 After-Sales Service
6.3 Customer Support Strategies
6.4 Engagement through Social Media
7. Value Proposition
7.1 Sustainability Initiatives
7.2 Integrated Supply Chains
7.3 Customer-Centric Approaches
7.4 Innovation in Offerings
8. Key Activities
8.1 Regulatory Compliance
8.2 Branding Efforts
8.3 Distribution Setup
8.4 Training and Development
9. Entry Strategy Evaluation
9.1 Domestic Market Entry Strategy
9.1.1 Product Mix Considerations
9.1.2 Pricing Band Strategy
9.1.3 Packaging Innovations
9.2 Export Entry Strategy
9.2.1 Target Countries Identification
9.2.2 Compliance Roadmap Development
10. Entry Mode Assessment
10.1 Joint Ventures
10.2 Greenfield Investments
10.3 Mergers & Acquisitions
10.4 Distributor Model Evaluation
11. Capital and Timeline Estimation
11.1 Capital Requirements Analysis
11.2 Timelines for Implementation
12. Control vs Risk Trade-Off
12.1 Ownership vs Partnerships
12.2 Risk Mitigation Strategies
13. Profitability Outlook
13.1 Breakeven Analysis
13.2 Long-Term Sustainability Strategies
14. Potential Partner List
14.1 Distributors
14.2 Joint Ventures
14.3 Acquisition Targets
15. Execution Roadmap
15.1 Phased Plan for Market Entry
15.1.1 Market Setup
15.1.2 Market Entry
15.1.3 Growth Acceleration
15.1.4 Scale & Stabilize
15.2 Key Activities and Milestones
15.2.1 Milestone Planning
15.2.2 Activity Tracking
Research Methodology
Phase 1: Approach1
Desk Research
- Analysis of industry reports from Australian grocery and e-commerce associations
- Review of government publications on online retail trends and consumer behavior
- Examination of market studies and white papers from logistics and supply chain experts
Primary Research
- Interviews with executives from leading online grocery platforms and quick commerce services
- Surveys targeting consumers to understand purchasing habits and preferences
- Focus groups with industry stakeholders, including suppliers and logistics providers
Validation & Triangulation
- Cross-validation of findings through multiple data sources, including sales data and consumer surveys
- Triangulation of insights from primary interviews with secondary research findings
- Sanity checks conducted through expert panel reviews and feedback sessions
Phase 2: Market Size Estimation1
Top-down Assessment
- Estimation of total market size based on national e-commerce growth rates and grocery spending
- Segmentation of the market by product categories and consumer demographics
- Incorporation of trends in consumer preferences towards convenience and speed of delivery
Bottom-up Modeling
- Collection of sales data from major online grocery retailers and quick commerce platforms
- Analysis of average order values and frequency of purchases across different consumer segments
- Estimation of operational costs and margins for various service offerings in the market
Forecasting & Scenario Analysis
- Development of predictive models based on historical growth patterns and market dynamics
- Scenario analysis considering economic factors, regulatory changes, and technological advancements
- Projections of market growth under different consumer behavior scenarios through 2030
Phase 3: CATI Sample Composition1
| Scope Item/Segment | Sample Size | Target Respondent Profiles |
|---|---|---|
| Online Grocery Shoppers | 150 | Frequent online grocery buyers, varied demographics |
| Quick Commerce Users | 100 | Consumers using rapid delivery services for groceries |
| Logistics Providers | 80 | Operations Managers, Delivery Coordinators |
| Retail Executives | 70 | CEOs, Marketing Directors of grocery retailers |
| Consumer Behavior Analysts | 60 | Market Researchers, Consumer Insights Managers |
Frequently Asked Questions
What is the current value of the Australia Online Grocery and Quick Commerce Market?
The Australia Online Grocery and Quick Commerce Market is valued at approximately USD 5 billion, reflecting significant growth driven by increased digital platform adoption and changing consumer preferences for convenience and time-saving solutions.
Which cities are the key players in the Australia Online Grocery Market?
What are the main types of products sold in the online grocery market in Australia?
How has consumer behavior shifted towards online grocery shopping in Australia?
Other Regional/Country Reports
Indonesia Online Grocery and Quick Commerce Market
Malaysia Online Grocery and Quick Commerce Market
KSA Online Grocery and Quick Commerce Market
APAC Online Grocery and Quick Commerce Market
SEA Online Grocery and Quick Commerce Market
Other Adjacent Reports
Malaysia E-Commerce Logistics Market
Mexico Last-Mile Delivery Market
Malaysia Food Delivery Services Market
UAE Supply Chain Management Market
Qatar Digital Payment Solutions Market
Vietnam Mobile Commerce Market
Vietnam Cold Chain Logistics Market
Malaysia Subscription Services Market
Brazil Retail Analytics Market
Japan Sustainable Packaging Market
Why Buy From Us?

What makes us stand out is that our consultants follow Robust, Refine and Result (RRR) methodology. Robust for clear definitions, approaches and sanity checking, Refine for differentiating respondents' facts and opinions, and Result for presenting data with story.

We have set a benchmark in the industry by offering our clients with syndicated and customized market research reports featuring coverage of entire market as well as meticulous research and analyst insights.

While we don't replace traditional research, we flip the method upside down. Our dual approach of Top Bottom & Bottom Top ensures quality deliverable by not just verifying company fundamentals but also looking at the sector and macroeconomic factors.

With one step in the future, our research team constantly tries to show you the bigger picture. We help with some of the tough questions you may encounter along the way: How is the industry positioned? Best marketing channel? KPI's of competitors? By aligning every element, we help maximize success.

Our report gives you instant access to the answers and sources that other companies might choose to hide. We elaborate each steps of research methodology we have used and showcase you the sample size to earn your trust.

If you need any support, we are here! We pride ourselves on universe strength, data quality, and quick, friendly, and professional service.