About the Report
Base Year 2024India PropTech Portals and Broker Tech Market Overview
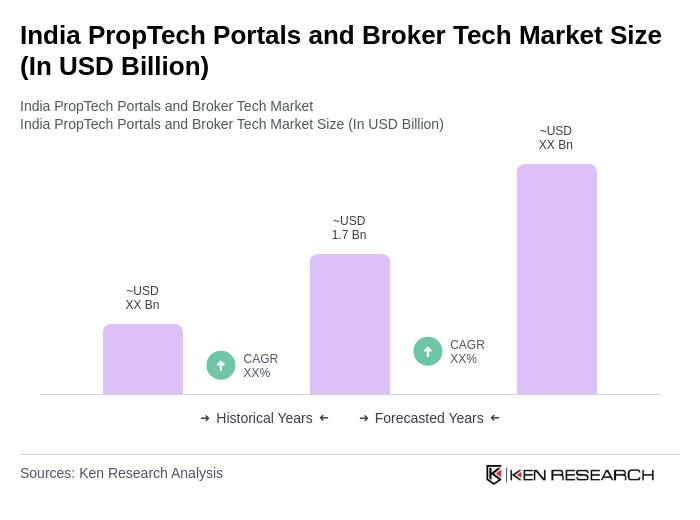
- The India PropTech Portals and Broker Tech Market is valued at USD 1.7 billion, based on a five-year historical analysis. This growth is primarily driven by the increasing adoption of digital platforms for real estate transactions, enhanced consumer awareness, and the rising demand for efficient property management solutions. The market has witnessed a significant shift towards technology-driven services, which has facilitated seamless interactions between buyers, sellers, and brokers. The integration of artificial intelligence, blockchain, and data analytics is further accelerating digital transformation in the sector, enabling virtual property tours, automated property management, and improved transaction transparency .
- Key cities dominating this market include Mumbai, Delhi, and Bengaluru. These urban centers are characterized by high population density, rapid urbanization, and a robust real estate sector, making them prime locations for PropTech innovations. The concentration of tech-savvy consumers and a growing startup ecosystem further bolster the market's growth in these regions. Additionally, the expansion of internet penetration and smartphone usage in these cities has accelerated the adoption of digital real estate solutions .
- The Real Estate (Regulation and Development) Act, 2016 (RERA), issued by the Ministry of Housing and Urban Affairs, is the primary regulatory framework governing the Indian real estate sector. RERA mandates the registration of real estate projects and agents, enforces disclosure requirements, and establishes a grievance redressal mechanism to protect buyers from fraudulent practices and enhance consumer confidence. The Act applies to both residential and commercial projects and requires developers to deposit a portion of project funds in escrow accounts, ensuring financial discipline and timely project delivery .
India PropTech Portals and Broker Tech Market Segmentation
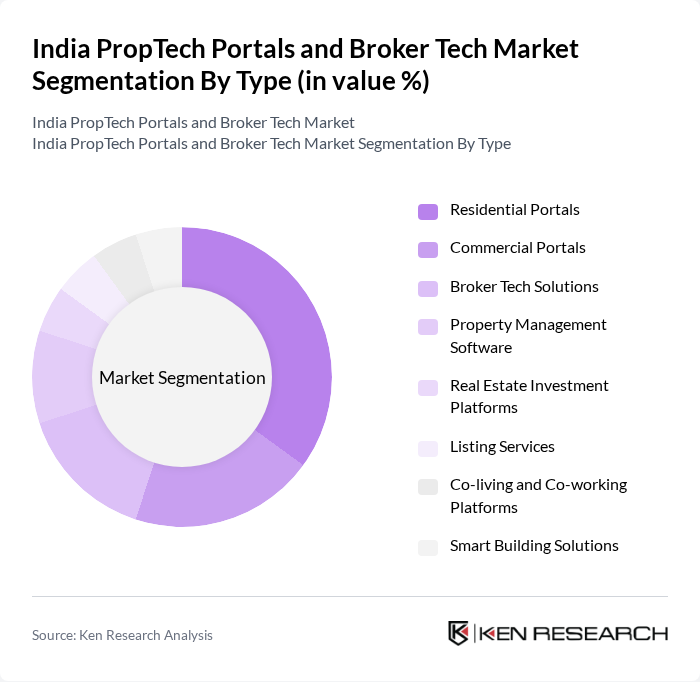
By Type:The market is segmented into various types, including Residential Portals, Commercial Portals, Broker Tech Solutions, Property Management Software, Real Estate Investment Platforms, Listing Services, Co-living and Co-working Platforms, and Smart Building Solutions. Among these, Residential Portals are currently leading the market due to the increasing demand for housing and the convenience offered by online platforms for property searches. The trend of urban migration and the growing middle-class population are significant factors driving the popularity of these portals. The adoption of virtual tours, AI-driven property recommendations, and secure online transactions is further strengthening the dominance of residential portals in the Indian PropTech landscape .
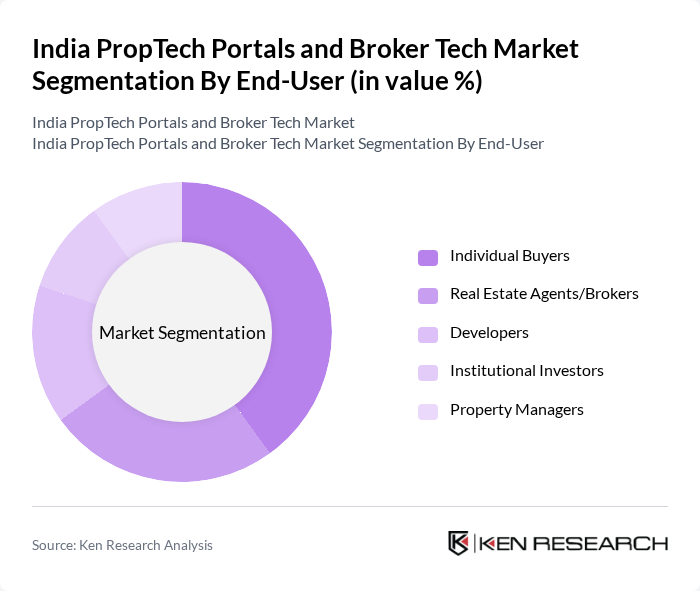
By End-User:The end-user segmentation includes Individual Buyers, Real Estate Agents/Brokers, Developers, Institutional Investors, and Property Managers. Individual Buyers dominate the market, driven by the increasing trend of home ownership and the convenience of online property searches. The rise of digital literacy, widespread internet access, and the availability of various financing options have further empowered individual buyers, making them a significant force in the PropTech landscape. Enhanced user experiences through mobile apps, personalized property recommendations, and transparent transaction processes are also contributing to this trend .
India PropTech Portals and Broker Tech Market Competitive Landscape
The India PropTech Portals and Broker Tech Market is characterized by a dynamic mix of regional and international players. Leading participants such as MagicBricks, 99acres, Housing.com, NoBroker, PropTiger, Square Yards, NestAway, OYO Life, ANAROCK, RealtyNXT, Homigo, Zolo Stays, QuikrHomes, HousingMan, Propstack, Broker Network, CRE Matrix, Furlenco, Brick&Bolt, PropertyAngel contribute to innovation, geographic expansion, and service delivery in this space.
India PropTech Portals and Broker Tech Market Industry Analysis
Growth Drivers
- Increasing Urbanization:Urbanization in India is projected to reach approximately 600 million people in future, with urban areas expected to contribute about 70% of GDP. This rapid urban growth drives demand for housing and real estate services, leading to increased activity in PropTech portals. The urban population's need for efficient property solutions is further supported by the government's focus on urban infrastructure development, which is expected to see investments of approximately INR 10 trillion in future.
- Digital Transformation in Real Estate:The digital transformation of the real estate sector is evident, with over 80% of property searches now conducted online. This shift is supported by the increasing penetration of smartphones, which reached over 750 million users in India in future. As consumers increasingly prefer digital platforms for property transactions, PropTech portals are positioned to capture this growing market, enhancing user experience through technology-driven solutions and streamlined processes.
- Government Initiatives for Housing:The Indian government has launched several initiatives, such as the Pradhan Mantri Awas Yojana (PMAY), aiming to provide affordable housing for all. With an allocation of INR 79,000 crore for the housing sector in the most recent budget, these initiatives stimulate demand for PropTech solutions. The focus on affordable housing is expected to create a significant market for digital platforms that facilitate property transactions and management.
Market Challenges
- Regulatory Hurdles:The PropTech market in India faces significant regulatory challenges, including compliance with the Real Estate (Regulation and Development) Act (RERA). Over 30% of real estate developers are still struggling to meet RERA compliance, which can hinder market entry for new PropTech solutions. These regulatory complexities can create barriers to innovation and slow down the adoption of digital platforms in the real estate sector.
- Data Privacy Concerns:With the increasing reliance on digital platforms, data privacy has become a critical concern. Approximately 60% of consumers express apprehension about sharing personal information online, which can deter them from using PropTech services. The lack of robust data protection regulations in India further exacerbates these concerns, making it essential for PropTech companies to prioritize data security to build consumer trust and ensure compliance with international standards.
India PropTech Portals and Broker Tech Market Future Outlook
The future of the India PropTech market appears promising, driven by technological advancements and evolving consumer preferences. As urbanization accelerates, the demand for innovative real estate solutions will likely increase. Additionally, the integration of AI and big data analytics will enhance property management and customer engagement. The market is expected to witness a surge in collaboration between PropTech firms and traditional real estate players, fostering a more integrated approach to property transactions and management.
Market Opportunities
- Expansion of Tier II and III Cities:The growth of Tier II and III cities presents a significant opportunity for PropTech companies. With urban migration expected to increase, these cities are projected to see a notable rise in housing demand in future. PropTech solutions tailored to these markets can capitalize on this trend, providing essential services to a growing population seeking affordable housing options.
- Integration of AI and Big Data:The integration of AI and big data analytics into PropTech platforms can revolutionize property management and customer service. The AI market in India is estimated to be valued at over INR 7,500 crore in future, indicating a strong potential for PropTech firms to leverage these technologies. Enhanced data-driven insights can improve decision-making processes, leading to more efficient property transactions and better customer experiences.
Scope of the Report
| Segment | Sub-Segments |
|---|---|
| By Type | Residential Portals Commercial Portals Broker Tech Solutions Property Management Software Real Estate Investment Platforms Listing Services Co-living and Co-working Platforms Smart Building Solutions |
| By End-User | Individual Buyers Real Estate Agents/Brokers Developers Institutional Investors Property Managers |
| By Region | North India South India East India West India |
| By Technology | Mobile Applications Web Portals CRM Solutions Data Analytics Tools AI & Machine Learning Platforms Blockchain Solutions |
| By Application | Property Listing Market Analysis Customer Relationship Management Transaction Management Rental Management Virtual Site Visits |
| By Investment Source | Private Equity Venture Capital Government Funding Crowdfunding |
| By Policy Support | Tax Incentives Subsidies for Startups Regulatory Support for Digital Platforms Others |
Key Target Audience
Investors and Venture Capitalist Firms
Government and Regulatory Bodies (e.g., Ministry of Housing and Urban Affairs, Real Estate Regulatory Authority)
Real Estate Developers and Builders
Property Management Companies
Real Estate Agents and Brokers
Technology Providers and Software Developers
Financial Institutions and Banks
Real Estate Investment Trusts (REITs)
Players Mentioned in the Report:
MagicBricks
99acres
Housing.com
NoBroker
PropTiger
Square Yards
NestAway
OYO Life
ANAROCK
RealtyNXT
Homigo
Zolo Stays
QuikrHomes
HousingMan
Propstack
Broker Network
CRE Matrix
Furlenco
Brick&Bolt
PropertyAngel
Table of Contents
Market Assessment Phase
1. Executive Summary and Approach
2. India PropTech Portals and Broker Tech Market Overview
2.1 Key Insights and Strategic Recommendations
2.2 India PropTech Portals and Broker Tech Market Overview
2.3 Definition and Scope
2.4 Evolution of Market Ecosystem
2.5 Timeline of Key Regulatory Milestones
2.6 Value Chain & Stakeholder Mapping
2.7 Business Cycle Analysis
2.8 Policy & Incentive Landscape
3. India PropTech Portals and Broker Tech Market Analysis
3.1 Growth Drivers
3.1.1 Increasing Urbanization
3.1.2 Digital Transformation in Real Estate
3.1.3 Government Initiatives for Housing
3.1.4 Rise of Remote Work Trends
3.2 Market Challenges
3.2.1 Regulatory Hurdles
3.2.2 High Competition
3.2.3 Data Privacy Concerns
3.2.4 Limited Consumer Awareness
3.3 Market Opportunities
3.3.1 Expansion of Tier II and III Cities
3.3.2 Integration of AI and Big Data
3.3.3 Collaboration with Financial Institutions
3.3.4 Growth of Co-living and Co-working Spaces
3.4 Market Trends
3.4.1 Adoption of Virtual Tours
3.4.2 Increased Focus on Sustainability
3.4.3 Rise of Blockchain in Real Estate
3.4.4 Shift Towards Mobile Platforms
3.5 Government Regulation
3.5.1 RERA Implementation
3.5.2 GST on Real Estate Transactions
3.5.3 Affordable Housing Policies
3.5.4 Land Acquisition Act Compliance
4. SWOT Analysis
5. Stakeholder Analysis
6. Porter's Five Forces Analysis
7. India PropTech Portals and Broker Tech Market Market Size, 2019-2024
7.1 By Value
7.2 By Volume
7.3 By Average Selling Price
8. India PropTech Portals and Broker Tech Market Segmentation
8.1 By Type
8.1.1 Residential Portals
8.1.2 Commercial Portals
8.1.3 Broker Tech Solutions
8.1.4 Property Management Software
8.1.5 Real Estate Investment Platforms
8.1.6 Listing Services
8.1.7 Co-living and Co-working Platforms
8.1.8 Smart Building Solutions
8.2 By End-User
8.2.1 Individual Buyers
8.2.2 Real Estate Agents/Brokers
8.2.3 Developers
8.2.4 Institutional Investors
8.2.5 Property Managers
8.3 By Region
8.3.1 North India
8.3.2 South India
8.3.3 East India
8.3.4 West India
8.4 By Technology
8.4.1 Mobile Applications
8.4.2 Web Portals
8.4.3 CRM Solutions
8.4.4 Data Analytics Tools
8.4.5 AI & Machine Learning Platforms
8.4.6 Blockchain Solutions
8.5 By Application
8.5.1 Property Listing
8.5.2 Market Analysis
8.5.3 Customer Relationship Management
8.5.4 Transaction Management
8.5.5 Rental Management
8.5.6 Virtual Site Visits
8.6 By Investment Source
8.6.1 Private Equity
8.6.2 Venture Capital
8.6.3 Government Funding
8.6.4 Crowdfunding
8.7 By Policy Support
8.7.1 Tax Incentives
8.7.2 Subsidies for Startups
8.7.3 Regulatory Support for Digital Platforms
8.7.4 Others
9. India PropTech Portals and Broker Tech Market Competitive Analysis
9.1 Market Share of Key Players
9.2 Cross Comparison of Key Players
9.2.1 Company Name
9.2.2 Group Size (Large, Medium, or Small as per industry convention)
9.2.3 Revenue Growth Rate (YoY %)
9.2.4 Customer Acquisition Cost (INR per user)
9.2.5 Customer Retention Rate (%)
9.2.6 Market Penetration Rate (%)
9.2.7 Average Deal Size (INR or USD)
9.2.8 Pricing Strategy (Freemium, Subscription, Transaction-based, etc.)
9.2.9 User Engagement Metrics (Monthly Active Users, Session Duration, etc.)
9.2.10 Conversion Rate (%)
9.2.11 Gross Merchandise Value (GMV)
9.2.12 Number of Listings
9.2.13 Geographic Coverage (Number of Cities/States)
9.2.14 Technology Adoption (AI, Blockchain, Mobile-first, etc.)
9.3 SWOT Analysis of Top Players
9.4 Pricing Analysis
9.5 Detailed Profile of Major Companies
9.5.1 MagicBricks
9.5.2 99acres
9.5.3 Housing.com
9.5.4 NoBroker
9.5.5 PropTiger
9.5.6 Square Yards
9.5.7 NestAway
9.5.8 OYO Life
9.5.9 ANAROCK
9.5.10 RealtyNXT
9.5.11 Homigo
9.5.12 Zolo Stays
9.5.13 QuikrHomes
9.5.14 HousingMan
9.5.15 Propstack
9.5.16 Broker Network
9.5.17 CRE Matrix
9.5.18 Furlenco
9.5.19 Brick&Bolt
9.5.20 PropertyAngel
10. India PropTech Portals and Broker Tech Market End-User Analysis
10.1 Procurement Behavior of Key Ministries
10.1.1 Government Housing Schemes
10.1.2 Infrastructure Development Projects
10.1.3 Urban Development Initiatives
10.2 Corporate Spend on Infrastructure & Energy
10.2.1 Investment in Smart Cities
10.2.2 Corporate Real Estate Management
10.2.3 Sustainability Initiatives
10.3 Pain Point Analysis by End-User Category
10.3.1 Home Buyers
10.3.2 Real Estate Agents
10.3.3 Developers
10.4 User Readiness for Adoption
10.4.1 Technology Adoption Rates
10.4.2 Training and Support Needs
10.5 Post-Deployment ROI and Use Case Expansion
10.5.1 Performance Metrics
10.5.2 User Feedback Mechanisms
11. India PropTech Portals and Broker Tech Market Future Size, 2025-2030
11.1 By Value
11.2 By Volume
11.3 By Average Selling Price
Go-To-Market Strategy Phase
1. Whitespace Analysis + Business Model Canvas
1.1 Market Gaps Identification
1.2 Business Model Framework
2. Marketing and Positioning Recommendations
2.1 Branding Strategies
2.2 Product USPs
3. Distribution Plan
3.1 Urban Retail Strategies
3.2 Rural NGO Tie-ups
4. Channel & Pricing Gaps
4.1 Underserved Routes
4.2 Pricing Bands
5. Unmet Demand & Latent Needs
5.1 Category Gaps
5.2 Consumer Segments
6. Customer Relationship
6.1 Loyalty Programs
6.2 After-sales Service
7. Value Proposition
7.1 Sustainability Initiatives
7.2 Integrated Supply Chains
8. Key Activities
8.1 Regulatory Compliance
8.2 Branding Efforts
8.3 Distribution Setup
9. Entry Strategy Evaluation
9.1 Domestic Market Entry Strategy
9.1.1 Product Mix
9.1.2 Pricing Band
9.1.3 Packaging
9.2 Export Entry Strategy
9.2.1 Target Countries
9.2.2 Compliance Roadmap
10. Entry Mode Assessment
10.1 Joint Ventures
10.2 Greenfield Investments
10.3 Mergers & Acquisitions
10.4 Distributor Model
11. Capital and Timeline Estimation
11.1 Capital Requirements
11.2 Timelines
12. Control vs Risk Trade-Off
12.1 Ownership vs Partnerships
13. Profitability Outlook
13.1 Breakeven Analysis
13.2 Long-term Sustainability
14. Potential Partner List
14.1 Distributors
14.2 Joint Ventures
14.3 Acquisition Targets
15. Execution Roadmap
15.1 Phased Plan for Market Entry
15.1.1 Market Setup
15.1.2 Market Entry
15.1.3 Growth Acceleration
15.1.4 Scale & Stabilize
15.2 Key Activities and Milestones
15.2.1 Activity Timeline
15.2.2 Milestone Tracking
Research Methodology
Phase 1: Approach1
Desk Research
- Analysis of market reports from real estate associations and industry publications
- Review of government policies and regulations impacting the PropTech sector
- Examination of financial reports and press releases from leading PropTech firms
Primary Research
- Interviews with founders and executives of PropTech startups
- Surveys targeting real estate agents and brokers using technology solutions
- Focus groups with end-users of PropTech platforms to gather user experience insights
Validation & Triangulation
- Cross-validation of findings with industry expert opinions and market trends
- Triangulation of data from multiple sources including user feedback and sales data
- Sanity checks through expert panel discussions and feedback loops
Phase 2: Market Size Estimation1
Top-down Assessment
- Estimation of total addressable market based on real estate transaction volumes
- Segmentation of market by technology type (e.g., CRM, listing platforms, analytics tools)
- Incorporation of growth rates from related sectors such as e-commerce and fintech
Bottom-up Modeling
- Data collection from PropTech companies on user adoption rates and revenue
- Estimation of average revenue per user (ARPU) across different platforms
- Volume analysis based on the number of transactions facilitated by PropTech solutions
Forecasting & Scenario Analysis
- Multi-variable forecasting using historical growth rates and market drivers
- Scenario analysis based on economic conditions and technological advancements
- Development of baseline, optimistic, and pessimistic growth projections through 2030
Phase 3: CATI Sample Composition1
| Scope Item/Segment | Sample Size | Target Respondent Profiles |
|---|---|---|
| Residential Real Estate Platforms | 120 | Real Estate Agents, Platform Users |
| Commercial Property Management Tools | 80 | Property Managers, Facility Managers |
| Real Estate Investment Analytics | 60 | Investment Analysts, Financial Advisors |
| Brokerage Technology Solutions | 90 | Brokerage Owners, Technology Officers |
| Smart Home Integration Services | 50 | Homeowners, Technology Enthusiasts |
Frequently Asked Questions
What is the current value of the India PropTech Portals and Broker Tech Market?
The India PropTech Portals and Broker Tech Market is valued at approximately USD 1.7 billion, driven by the increasing adoption of digital platforms for real estate transactions and enhanced consumer awareness.
Which cities are leading in the India PropTech market?
What are the main types of services offered in the India PropTech market?
Who are the primary end-users of PropTech solutions in India?
Other Regional/Country Reports
Indonesia PropTech Portals and Broker Tech Market
Malaysia PropTech Portals and Broker Tech Market
KSA PropTech Portals and Broker Tech Market
APAC PropTech Portals and Broker Tech Market
SEA PropTech Portals and Broker Tech Market
Vietnam PropTech Portals and Broker Tech Market
Other Adjacent Reports
South Korea Real Estate Investment Platforms Market
Germany Residential Portals Market
Vietnam Commercial Portals Market
South Africa Broker Tech Solutions Market
Belgium Listing Services Market
Egypt Co-living Platforms Market
Oman Co-working Platforms Market
Singapore Smart Building Solutions Market
Indonesia Real Estate FinTech Market
Why Buy From Us?

What makes us stand out is that our consultants follow Robust, Refine and Result (RRR) methodology. Robust for clear definitions, approaches and sanity checking, Refine for differentiating respondents' facts and opinions, and Result for presenting data with story.

We have set a benchmark in the industry by offering our clients with syndicated and customized market research reports featuring coverage of entire market as well as meticulous research and analyst insights.

While we don't replace traditional research, we flip the method upside down. Our dual approach of Top Bottom & Bottom Top ensures quality deliverable by not just verifying company fundamentals but also looking at the sector and macroeconomic factors.

With one step in the future, our research team constantly tries to show you the bigger picture. We help with some of the tough questions you may encounter along the way: How is the industry positioned? Best marketing channel? KPI's of competitors? By aligning every element, we help maximize success.

Our report gives you instant access to the answers and sources that other companies might choose to hide. We elaborate each steps of research methodology we have used and showcase you the sample size to earn your trust.

If you need any support, we are here! We pride ourselves on universe strength, data quality, and quick, friendly, and professional service.