CHAPTER 1 - MARKET SUMMARY
Market Overview
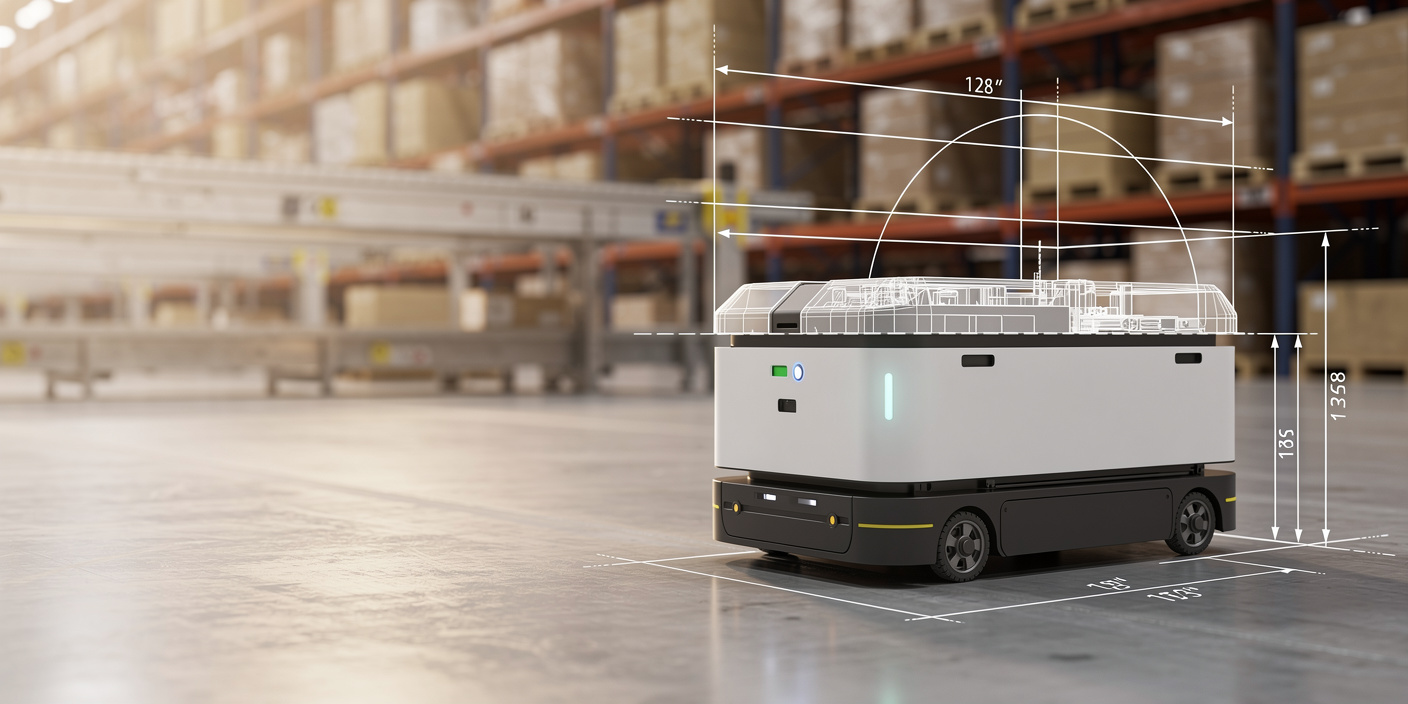
The Saudi Arabia Warehouse Automation Market serves operators investing in storage, movement, picking, sorting, packing and inventory-control technologies. Demand is structurally linked to digital commerce and fulfillment intensity. Saudi Arabia was projected to have 34.5 million e-commerce users in 2025, while e-commerce revenue was forecast to reach USD 69 billion, strengthening the business case for automated, high-throughput distribution infrastructure.
Riyadh is the dominant automation demand hub because it combines national retail headquarters, fulfillment centers, industrial estates and central distribution operations. In 2024, Riyadh contained 6,763 licensed commercial warehouses covering 10.7 million square meters. This represented 55.3% of licensed warehouses nationally, creating a concentrated addressable pool for automated storage, picking, conveyor, robotics and warehouse software investments.
Market Value
USD 211.0 million
2025
Dominant Region
Riyadh Region
2025
Dominant Segment
Automated Storage and Retrieval Systems
fastest growing, 2026-2031
Total Number of Players
136
Future Outlook
The Saudi Arabia Warehouse Automation Market is projected to increase from USD 211.0 million in 2025 to USD 493.4 million by 2031. Historical expansion averaged 21.7% annually during 2020-2025 as e-commerce operators, pharmaceutical distributors and large retailers accelerated investments in warehouse management systems, conveyors, automated storage and robotic picking. Growth moderated from the pandemic-era acceleration but remained structurally strong in 2025, when the modeled market supported approximately 96 equivalent automation deployments. The forecast assumes continued logistics-zone development, higher throughput requirements and sustained investments by national distributors, manufacturers and contract logistics operators.
Forecast growth of 15.2% during 2026-2031 will increasingly be driven by higher-value integrated systems rather than standalone equipment purchases. Average automation contract value is projected to rise from USD 2.20 million in 2025 to USD 2.85 million by 2031 as customers combine storage hardware, mobile robotics, warehouse-control software, machine vision and lifecycle support. Automated storage and retrieval systems will remain the largest solution pool, while autonomous mobile robots and orchestration software will record faster adoption. Riyadh will retain the largest regional revenue contribution, although Jeddah and the Eastern Province will gain from port-linked distribution and industrial logistics projects.
15.2%
Forecast CAGR
$493.4 Mn
2030 Projection
Base Year
2025
Historical Period
2020-2025
Forecast Period
2026-2031
Historical CAGR
21.7%
CHAPTER 2 - SCOPE OF REPORT
Scope of the Market
CHAPTER 3 - Key Stakeholders
Key Target Audience
Key stakeholders who can leverage from this market analysis for investment, strategy, and operational planning.
Market sizing and trajectory
Policy and compliance mapping
Automation investment indicators
Segment structure and levers
Competitive landscape shortlist
CEO-grade risk priorities
CHAPTER 4 - Market Size & Growth
Market Size, Growth Forecast and Trends
This section evaluates the historical market size, analyzes year-over-year growth dynamics, and presents forecast projections supported by market performance indicators and demand-side drivers.
Historical & Projected Market Size ($ Million)
Year-over-Year Growth Rate (%)
Market Value vs Volume Growth (%)
Historical Market Performance (2020-2025)
Historical growth peaked at 24.6% in 2022 as large retailers and distributors moved beyond basic warehouse software toward conveyor, sortation and goods-to-person systems. Deployment volume increased from 49 equivalent projects in 2020 to 96 in 2025, while modeled average contract value rose from USD 1.61 million to USD 2.20 million. The difference between value and volume growth reflects greater software content, higher system complexity and larger project footprints. Riyadh captured the largest concentration of spending, supported by its 55.3% share of licensed commercial warehouses in 2024.
Forecast Market Outlook (2026-2031)
The forecast period is expected to deliver 15.2% annual value growth, taking the market to USD 493.4 million in 2031. Equivalent annual deployments are projected to reach 173, representing a 10.3% volume CAGR from 2025. Market value will expand faster than project count because contracts will include more robotics, orchestration software, machine vision, cybersecurity and lifecycle services. Automation penetration across addressable medium and large warehouses is projected to increase from 27% in 2025 to 51% in 2031, creating a larger recurring service and upgrade revenue pool.
CHAPTER 5 - Market Data
Market Breakdown
The Saudi Arabia Warehouse Automation Market is shifting from isolated equipment purchases toward integrated, software-led fulfillment infrastructure. For CEOs and investors, the main value-creation levers are deployment scale, system complexity, recurring software revenue and penetration of the existing licensed warehouse base.
Year | Market Size (USD Mn) | YoY Growth (%) | Equivalent Automation Deployments | Average Contract Value (USD Mn) | Addressable Warehouse Automation Penetration | Period |
|---|---|---|---|---|---|---|
| 2020 | $79.0 Mn | +- | 49 | 1.61 | Forecast | |
| 2021 | $97.8 Mn | +23.8% | 57 | 1.72 | Forecast | |
| 2022 | $121.9 Mn | +24.6% | 67 | 1.82 | Forecast | |
| 2023 | $147.6 Mn | +21.1% | 77 | 1.92 | Forecast | |
| 2024 | $177.5 Mn | +20.3% | 87 | 2.04 | Forecast | |
| 2025 | $211.0 Mn | +18.9% | 96 | 2.20 | Forecast | |
| 2026 | $243.1 Mn | +15.2% | 106 | 2.29 | Forecast | |
| 2027 | $280.0 Mn | +15.2% | 118 | 2.37 | Forecast | |
| 2028 | $322.6 Mn | +15.2% | 130 | 2.48 | Forecast | |
| 2029 | $371.7 Mn | +15.2% | 142 | 2.62 | Forecast | |
| 2030 | $428.2 Mn | +15.2% | 156 | 2.75 | Forecast | |
| 2031 | $493.4 Mn | +15.2% | 173 | 2.85 | Forecast |
Equivalent Automation Deployments
96 deployments, 2025, Saudi Arabia. Suppliers require repeatable engineering and local maintenance capacity to convert project growth into sustainable margins. Saudi Arabia had 12,234 licensed commercial warehouses covering 22 million square meters in 2024.
Average Contract Value
USD 2.20 million, 2025, Saudi Arabia. Rising contract values indicate deeper software, robotics and integration content rather than equipment inflation alone. Chalhoub Group's Riyadh automation project includes 67,000 AutoStore bins and 42 robots.
Automation Penetration
27%, 2025, addressable Saudi warehouses. Penetration remains below mature logistics hubs, creating a substantial retrofit pipeline. Licensed delivery applications completed more than 290 million orders in 2024, up 27.2% year over year.
CHAPTER 6 - Segmentation
Market Segmentation Framework
Comprehensive analysis across key dimensions providing insights into market structure, consumer preferences, and distribution patterns.
No of Segments
7
Dominant Segment
Solution Type
Fastest Growing Segment
Technology
Solution Type
Technology
Application
End-Use Industry
Customer Type
Sales Channel
Geography
Key Segmentation Takeaways
Comprehensive analysis across all extracted segmentation dimensions providing insights into market structure, consumer preferences, and distribution patterns.
Solution Type
Solution Type is the dominant segmentation dimension because warehouse owners procure automation through integrated system packages with measurable capacity, throughput and service-level outcomes. Automated Storage and Retrieval Systems form the largest Level-2 revenue pool, supported by high-bay storage economics, land optimization and demand for controlled inventory movement in retail, pharmaceutical, food and industrial distribution centers.
Technology
Technology is the fastest-growing segmentation dimension as customers increasingly adopt flexible robots and AI-enabled orchestration instead of relying exclusively on fixed conveyors. Autonomous Mobile Robots represent the fastest-expanding Level-2 category because they can be introduced incrementally, redeployed during demand peaks and integrated into brownfield facilities with lower structural modification requirements than conventional fixed automation.
CHAPTER 7 - Regional Analysis
Regional Analysis
Saudi Arabia ranks first among selected Gulf peers by modeled 2025 warehouse automation revenue, supported by the GCC's largest licensed warehouse base and a national logistics-zone expansion program. The UAE remains the closest competitor due to its mature third-party logistics and free-zone ecosystem, while Qatar, Kuwait and Oman represent smaller but increasingly automation-intensive markets.
Focus Country Ranking
1st
Focus Country Market Size
USD 211.0 Mn (2025)
Focus Country CAGR (2026-2031)
15.2%
Focus Country Ranking
1st
Focus Country Market Size
USD 211.0 Mn (2025)
Focus Country CAGR (2026-2031)
15.2%
Regional Analysis (Current Year)
Market Position
Saudi Arabia ranks first among the five selected Gulf markets with USD 211.0 million in 2025 revenue, supported by 22 million square meters of licensed commercial warehouse area.
Growth Advantage
Saudi Arabia's 15.2% forecast CAGR exceeds the UAE's modeled 13.7% and Kuwait's 12.6%, reflecting a larger greenfield pipeline and lower automation penetration across existing warehouses.
Competitive Strengths
The Kingdom combines 23 activated logistics centers, a target of 59 logistics zones and more than 290 million annual delivery orders, creating concentrated demand for scalable automation.
CHAPTER 8 - INDUSTRY ANALYSIS
Growth Drivers, Market Challenges & Market Opportunities
Comprehensive analysis of key factors shaping the Saudi Arabia Warehouse Automation Market Size, Share & Forecast, By Solution Type, Technology & End-Use Industry, 2026-2031, including growth catalysts, operational challenges, and emerging opportunities across production, distribution, and consumer segments.
Growth Drivers
Expansion of E-commerce and Omnichannel Fulfillment
- E-commerce revenue was projected to reach USD 69 billion (2025, Saudi Arabia), expanding the addressable volume for automated storage, picking and parcel-sortation systems used by marketplaces, retailers and fulfillment operators.
- Licensed delivery applications completed more than 290 million orders (2024, Saudi Arabia), up 27.2%, increasing peak-period capacity requirements and strengthening returns from goods-to-person picking, conveyors and orchestration software.
- Saudi Arabia recorded 40,953 active e-commerce commercial registrations (Q4 2024, Saudi Arabia), widening the downstream customer base for shared fulfillment centers, cloud WMS platforms and modular automation services.
National Logistics and Warehouse Infrastructure Expansion
- Saudi Arabia targets 59 logistics zones by 2030, creating greenfield demand for high-bay AS/RS, dock automation, warehouse software and integrated material-flow systems across airports, ports and industrial corridors.
- The country had 12,234 licensed commercial warehouses covering 22 million sqm (2024, Saudi Arabia), giving automation vendors a substantial brownfield retrofit pool in addition to new distribution-center construction.
- MODON's investor base reached 7,946 industrial and logistics investors (2023, Saudi Arabia), supporting demand for automated production logistics, spare-parts storage, pallet movement and finished-goods distribution.
Higher Service Levels and Sector-Specific Traceability
- Average parcel delivery time declined to 2 days (2024, Saudi Arabia), requiring synchronized inventory visibility, automated picking and faster dispatch planning to prevent warehouse operations becoming the service bottleneck.
- Nahdi's automated pharmaceutical distribution center can process 200 million SKU units annually (2022, Saudi Arabia), demonstrating the scale attainable through integrated temperature control, AS/RS and warehouse software.
- Chalhoub Group's Riyadh logistics hub includes 67,000 bins and 42 robots (2025, Saudi Arabia), validating high-density robotic fulfillment for fashion, beauty and e-commerce applications.
Market Challenges
Imported Equipment Dependence and High Upfront Capital
- The modeled average warehouse automation contract reached USD 2.20 million (2025, Saudi Arabia), limiting adoption among smaller operators unless vendors provide phased implementation, leasing or subscription-based robotics.
- Complex systems require imported cranes, shuttles, controls, sensors and robots, exposing projects to shipping delays across a freight network handling 331.3 million tons by sea (2024, Saudi Arabia).
- Customers with uncertain volume forecasts may delay fixed automation because addressable penetration was only 27% (2025, modeled Saudi warehouses), favoring modular systems with faster payback and lower irreversible capital commitments.
Integration Complexity and Limited Automation Skills
- Brownfield projects must connect automation with existing ERP, WMS and manual processes across 12,234 licensed commercial warehouses (2024, Saudi Arabia), increasing commissioning time and operational-disruption risk.
- Saudi delivery operations involved more than 442,000 active drivers (2024, Saudi Arabia), illustrating the scale of labor-intensive logistics that must be reskilled rather than simply displaced by automation.
- Integrated systems must sustain high availability after commissioning, while the market contains an estimated 136 active vendors, integrators and specialist partners (2025, Saudi Arabia) with uneven engineering and lifecycle-service capabilities.
Compliance, Cybersecurity and Operational Continuity
- Municipal rules cover warehouse location, operating conditions and safety, affecting retrofit feasibility across 22 million sqm of licensed commercial warehouse area (2024, Saudi Arabia).
- Pharmaceutical facilities must maintain documented good storage and distribution practices, making traceability and environmental monitoring essential for systems handling up to 200 million units annually (2022, Saudi Arabia).
- Connected robots and warehouse-control systems increase cyber exposure, while 96% on-time delivery compliance (2024, Saudi Arabia) leaves limited tolerance for software outages or failed system interfaces.
Market Opportunities
Brownfield Retrofit and Lifecycle Services
- Vendors can monetize phased upgrades through vertical lifts, pallet shuttles, AMRs, WMS modules and multiyear maintenance contracts across a modeled 73% non-automated addressable base (2025, Saudi Arabia).
- Riyadh offers the highest account density, with 6,763 warehouses and 10.7 million sqm (2024, Riyadh Region), lowering sales, engineering and field-service costs for focused integrators.
- Opportunity realization requires open interfaces and staged commissioning because operators must preserve daily throughput across more than 290 million annual delivery orders (2024, Saudi Arabia).
Robotics-as-a-Service and Modular Automation
- Recurring revenue can be generated through robot subscriptions, cloud WMS licenses, uptime guarantees and per-transaction pricing, reducing customer exposure to modeled contracts averaging USD 2.20 million (2025, Saudi Arabia).
- 3PLs, digital retailers and SME fulfillment providers benefit because modular AMRs can be redeployed across customers and peaks serving 34.5 million e-commerce users (2025, Saudi Arabia).
- Adoption requires standardized APIs, reliable wireless coverage and financing products that move automation spending from upfront capital toward predictable operating costs over 3-to-7-year contract periods.
Specialized Pharmaceutical, Cold-Chain and Free-Zone Automation
- Investors can target higher-margin automation for temperature-controlled storage, serialized inventory, regulated picking and validated software where compliance requirements create stronger vendor differentiation and recurring service demand.
- Retail, beauty and luxury distributors benefit from dense robotic storage, as the Chalhoub Riyadh hub will operate 67,000 bins and 42 robots (2025, Saudi Arabia).
- Realization depends on continued free-zone and logistics-corridor development toward the national target of 59 logistics zones by 2030, with automation specified during facility design rather than added after construction.
CHAPTER 9 - Competitive Landscape
Competitive Landscape Overview
The market is moderately concentrated among global automation specialists and regional integrators. Entry barriers arise from project references, systems engineering, software integration, working-capital requirements, local service capability and long commissioning cycles.
Market Share Distribution
Top 5 Players
Market Dynamics
8 new entrants in the past 5 years, indicating strong market attractiveness and growth potential.
Company Name | Market Share | Headquarters | Founding Year | Core Market Focus |
|---|---|---|---|---|
SSI SCHAEFER | - | Neunkirchen, Germany | 1937 | AS/RS, conveyors, picking systems, WAMAS software and turnkey automation |
Swisslog | - | Buchs, Switzerland | 1900 | AutoStore integration, robotic fulfillment, pallet automation and SynQ software |
Dematic | - | Atlanta, United States | 2006 | Conveyors, sortation, AS/RS, automated picking and warehouse execution systems |
Honeywell Intelligrated | - | Mason, United States | 2001 | Material handling, sortation, robotics, controls and warehouse execution software |
Vanderlande | - | Veghel, Netherlands | 1949 | Warehouse sortation, goods-to-person systems, robotics and parcel automation |
Daifuku | - | Osaka, Japan | 1937 | AS/RS, AGVs, conveyors, factory logistics and automated material handling |
KNAPP | - | Hart bei Graz, Austria | 1952 | Shuttle systems, robotics, AI orchestration, WMS and pharmaceutical automation |
Mecalux | - | Barcelona, Spain | 1966 | Automated storage, pallet shuttles, racking, conveyors and Easy WMS |
Kardex | - | Zurich, Switzerland | 1898 | Vertical storage, mini-load systems, high-bay automation and lifecycle services |
Geekplus | - | Beijing, China | 2015 | Autonomous mobile robots, goods-to-person fulfillment and robot orchestration |
Cross Comparison Parameters
The report provides detailed cross-comparison of key players across 10 performance parameters to identify competitive strengths and weaknesses.
Installed Automated Storage Capacity
System Throughput and Uptime
Saudi Project Revenue Growth
Lifecycle Service Revenue Margin
Analysis Covered
Market Share Analysis:
Quantifies supplier concentration across disclosed projects and modeled revenue pools
Cross Comparison Matrix:
Benchmarks throughput, uptime, delivery scale, software depth and service economics
SWOT Analysis:
Assesses technology differentiation, localization readiness, execution risk and customer access
Pricing Strategy Analysis:
Compares turnkey contracts, subscriptions, maintenance fees and modular deployment economics
Company Profiles:
Maps Saudi presence, sector focus, references, capabilities and partnership models
CHAPTER 10 - REPORT TOC
Market Report Structure
Comprehensive coverage across three strategic phases — Market Assessment, Go-To-Market Strategy, and Survey — delivering end-to-end insights from market analysis and execution roadmap to customer demand validation.
Market Assessment Phase
Supply-side and competitive intelligence covering market sizing, segmentation, competitive dynamics, regulatory landscape, and future forecasts.
Go-To-Market Strategy Phase
15 chapters
Entry strategy evaluation, execution roadmap, partner recommendations, and profitability outlook.
Survey Phase
8 chapters
Demand-side primary research conducted through structured interviews and online surveys with end users across priority metros and Tier 2/3 cities to capture consumption behavior, unmet needs, and purchase drivers.
Complete Report Coverage
201+ detailed sections covering every aspect of the market
143
Assessment Sections
58
Strategy Sections
CHAPTER 11 - Our Approach
Research Methodology
Desk Research
- Mapped licensed Saudi warehouse stock
- Reviewed logistics-zone investment pipelines
- Analyzed automation vendor project references
- Benchmarked e-commerce fulfillment indicators
Primary Research
- Interviewed warehouse operations directors
- Consulted automation solutions architects
- Engaged supply-chain technology heads
- Surveyed system integration managers
Validation and Triangulation
- Validated through 302 respondents
- Reconciled project and revenue estimates
- Cross-checked deployment and pricing assumptions
- Tested forecast scenarios with operators
CHAPTER 12 - FAQ
FAQs
Still have questions?
Our research team is here to help you find the right solution
CHAPTER 13 - Related Research
Explore Related Reports
Expand your market intelligence with complementary research across regions and adjacent markets.
Regional/Country ReportsRelated market analysis across key regions
Related market analysis across key regions
- Vietnam Warehouse Automation Market Size, Share & Forecast, By Solution Type, End-Use Industry & Technology, 2025–2032
- Asia Pacific Warehouse Automation Market Size, Share & Forecast, By Solution Type, Automation Level & End-Use Industry, 2025-2032
- South Korea Warehouse Automation Market
- South Africa Warehouse Automation Market
- UAE Warehouse Automation (AMRs, AS/RS, WES) Market Size, Share, Growth Drivers, Trends, Opportunities, Competitive Landscape & Forecast 2025–2030
Adjacent ReportsRelated markets and complementary research
Related markets and complementary research
- Belgium Logistics Hub Development Market
- Singapore E-Commerce Fulfillment Systems Market
- Qatar Warehouse Management Software Market
- Philippines Industrial Robotics Integration Market
- Japan Cloud-Based Supply Chain Analytics Market
500+
Market Research Reports
50+
Countries Covered
15+
Industry Verticals