About the Report
Base Year 2024APAC Metamaterials Market Overview
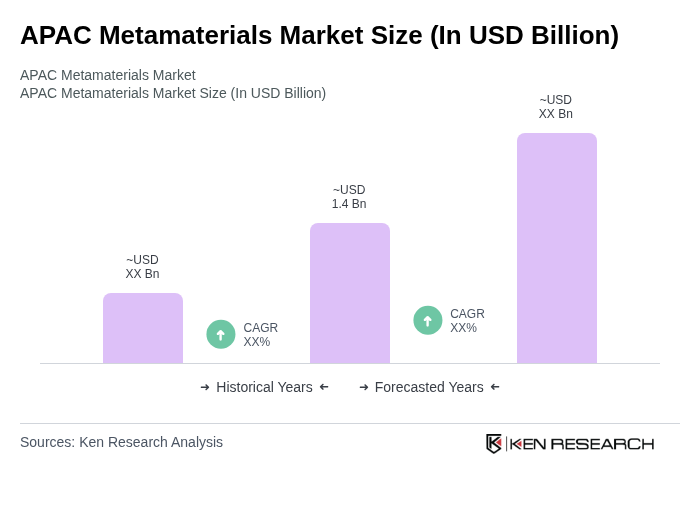
- The APAC Metamaterials Market is valued at USD 1.4 billion, based on a five-year historical analysis. This growth is primarily driven by advancements in telecommunications, the rapid expansion of consumer electronics, and the increasing adoption of metamaterials in healthcare and medical imaging. The market is further supported by robust investments in research and development, particularly in China, Japan, and South Korea, which are enhancing the capabilities and applications of metamaterials across multiple sectors .
- Key players in this market include China, Japan, and South Korea, which dominate due to their robust manufacturing capabilities, strong research institutions, and government support for innovation. China leads in production and consumption, while Japan and South Korea are recognized for their technological advancements and high-quality product offerings, making them significant contributors to the market's growth .
- In 2023, the Indian government launched the "Scheme for Promotion of Research and Innovation in Advanced Materials" under the Department of Science & Technology, allocating INR 200 crore to support startups and research institutions. This initiative aims to foster innovation and enhance the country's capabilities in advanced materials, positioning India as a competitive player in the global metamaterials market. The scheme mandates compliance with national R&D funding guidelines and prioritizes projects with commercial scalability .
APAC Metamaterials Market Segmentation
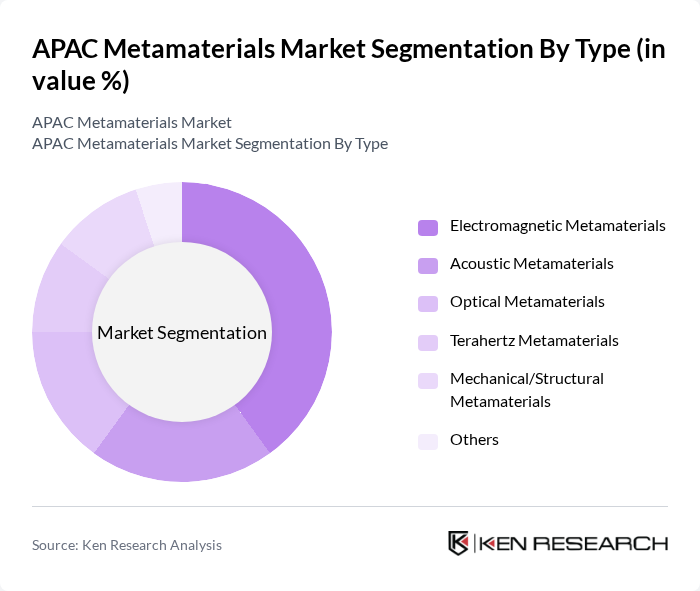
By Type:The market is segmented into various types of metamaterials, including Electromagnetic Metamaterials, Acoustic Metamaterials, Optical Metamaterials, Terahertz Metamaterials, Mechanical/Structural Metamaterials, and Others. Among these, Electromagnetic Metamaterials are leading due to their extensive applications in telecommunications, antennas, and radar technologies. The demand for high-frequency antennas and devices is driving growth in this segment, as industries seek to enhance performance and efficiency .
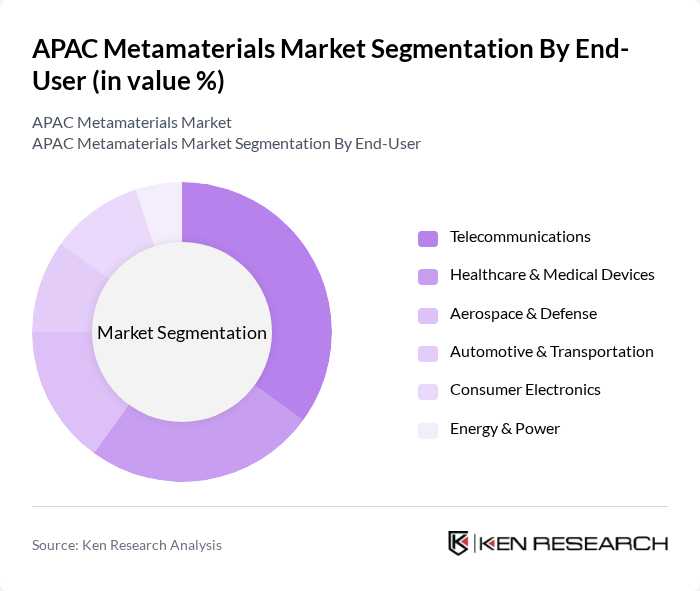
By End-User:The end-user segmentation includes Telecommunications, Healthcare & Medical Devices, Aerospace & Defense, Automotive & Transportation, Consumer Electronics, Energy & Power, and Others. The Telecommunications sector is the dominant end-user, driven by the increasing demand for advanced communication systems, high-performance antennas, and the rapid rollout of 5G technology, which is accelerating the adoption of metamaterials in this sector .
APAC Metamaterials Market Competitive Landscape
The APAC Metamaterials Market is characterized by a dynamic mix of regional and international players. Leading participants such as Meta Materials Inc. (Canada, active in APAC), Nanoscribe GmbH (BICO Group, Germany, APAC presence), Kymeta Corporation (USA, APAC distribution), Echodyne Corp. (USA, APAC partnerships), Advanced Fiber Resources (Zhuhai), Ltd. (China), Zhejiang Hisun Advanced Materials Co., Ltd. (China), TeraView Ltd. (UK, APAC operations), Lightwave Logic, Inc. (USA, APAC sales), Aether Industries Limited (India), Murata Manufacturing Co., Ltd. (Japan), NEC Corporation (Japan), Samsung Electro-Mechanics (South Korea), Panasonic Corporation (Japan), TDK Corporation (Japan), Shenzhen Kuang-Chi Advanced Technology Co., Ltd. (China) contribute to innovation, geographic expansion, and service delivery in this space.
APAC Metamaterials Market Industry Analysis
Growth Drivers
- Increasing Demand for Advanced Materials in Electronics:The APAC electronics sector is projected to reach $1.7 trillion in future, driven by innovations in consumer electronics and smart devices. Metamaterials, with their unique properties, are increasingly being integrated into products like smartphones and wearables. This demand is further fueled by the rise of 5G technology, which requires advanced materials for efficient signal transmission. The growing electronics market is a significant driver for metamaterials adoption in the region.
- Rising Investments in R&D for Innovative Applications:In future, APAC countries are expected to invest over $250 billion in research and development for advanced materials, including metamaterials. This investment is crucial for fostering innovation in sectors such as telecommunications and healthcare. For instance, Japan and South Korea are leading in R&D spending, focusing on developing metamaterials for applications like wireless communication and medical imaging, which enhances the market's growth potential.
- Expanding Applications in Telecommunications and Healthcare:The telecommunications sector in APAC is anticipated to grow to $600 billion in future, with metamaterials playing a pivotal role in enhancing communication technologies. Additionally, the healthcare market is projected to reach $1.2 trillion, where metamaterials are utilized in imaging and diagnostics. The convergence of these sectors creates a robust demand for metamaterials, driving their adoption across various applications in the region.
Market Challenges
- High Production Costs of Metamaterials:The production costs for metamaterials can exceed $120 per gram, significantly higher than traditional materials. This cost barrier limits widespread adoption, particularly among small and medium enterprises. As the market matures, achieving economies of scale will be essential to reduce costs and make metamaterials more accessible to various industries, including electronics and healthcare.
- Limited Awareness and Understanding Among End-Users:Despite the potential of metamaterials, many end-users remain unaware of their benefits and applications. A survey indicated that over 65% of industry professionals lack knowledge about metamaterials, hindering their adoption. Educational initiatives and targeted marketing strategies are necessary to bridge this knowledge gap and promote the advantages of metamaterials in various sectors, including telecommunications and defense.
APAC Metamaterials Market Future Outlook
The APAC metamaterials market is poised for significant growth, driven by technological advancements and increasing applications across various sectors. As industries prioritize innovation, the integration of metamaterials in consumer electronics and renewable energy solutions will become more prevalent. Additionally, collaborations between research institutions and tech companies will foster new product developments, enhancing the market's competitive landscape. The focus on sustainability will further propel the demand for eco-friendly metamaterials, shaping the future of the industry in the region.
Market Opportunities
- Development of New Applications in Defense and Aerospace:The defense sector in APAC is projected to reach $600 billion in future, creating opportunities for metamaterials in stealth technology and advanced radar systems. The unique properties of metamaterials can enhance performance in these applications, making them attractive for military and aerospace industries, which are increasingly investing in innovative technologies.
- Integration of Metamaterials in Renewable Energy Solutions:The renewable energy market in APAC is expected to surpass $400 billion in future. Metamaterials can improve the efficiency of solar panels and wind turbines, presenting a significant opportunity for growth. As countries focus on sustainable energy solutions, the demand for advanced materials that enhance energy efficiency will rise, positioning metamaterials as a key player in this transition.
Scope of the Report
| Segment | Sub-Segments |
|---|---|
| By Type | Electromagnetic Metamaterials Acoustic Metamaterials Optical Metamaterials Terahertz Metamaterials Mechanical/Structural Metamaterials Others |
| By End-User | Telecommunications Healthcare & Medical Devices Aerospace & Defense Automotive & Transportation Consumer Electronics Energy & Power Others |
| By Region | China Japan South Korea India Rest of Asia-Pacific |
| By Technology | D Printing/Additive Manufacturing Nano-fabrication Lithography Laser Processing Others |
| By Application | Antennas & Radars Telecommunications Infrastructure Medical Imaging & Sensors Energy Harvesting Optical Devices (e.g., AR/VR, Lenses) Cloaking Devices Others |
| By Investment Source | Private Investments Government Funding Venture Capital Corporate R&D Others |
| By Policy Support | Research Grants Tax Incentives Subsidies for R&D Standards & Certification Programs Others |
Key Target Audience
Investors and Venture Capitalist Firms
Government and Regulatory Bodies (e.g., Ministry of Electronics and Information Technology, National Institute of Standards and Technology)
Manufacturers and Producers
Distributors and Retailers
Telecommunications Companies
Aerospace and Defense Contractors
Healthcare Technology Firms
Energy Sector Companies
Players Mentioned in the Report:
Meta Materials Inc. (Canada, active in APAC)
Nanoscribe GmbH (BICO Group, Germany, APAC presence)
Kymeta Corporation (USA, APAC distribution)
Echodyne Corp. (USA, APAC partnerships)
Advanced Fiber Resources (Zhuhai), Ltd. (China)
Zhejiang Hisun Advanced Materials Co., Ltd. (China)
TeraView Ltd. (UK, APAC operations)
Lightwave Logic, Inc. (USA, APAC sales)
Aether Industries Limited (India)
Murata Manufacturing Co., Ltd. (Japan)
NEC Corporation (Japan)
Samsung Electro-Mechanics (South Korea)
Panasonic Corporation (Japan)
TDK Corporation (Japan)
Shenzhen Kuang-Chi Advanced Technology Co., Ltd. (China)
Table of Contents
Market Assessment Phase
1. Executive Summary and Approach
2. APAC Metamaterials Market Overview
2.1 Key Insights and Strategic Recommendations
2.2 APAC Metamaterials Market Overview
2.3 Definition and Scope
2.4 Evolution of Market Ecosystem
2.5 Timeline of Key Regulatory Milestones
2.6 Value Chain & Stakeholder Mapping
2.7 Business Cycle Analysis
2.8 Policy & Incentive Landscape
3. APAC Metamaterials Market Analysis
3.1 Growth Drivers
3.1.1 Increasing demand for advanced materials in electronics
3.1.2 Rising investments in R&D for innovative applications
3.1.3 Expanding applications in telecommunications and healthcare
3.1.4 Growing awareness of sustainable materials
3.2 Market Challenges
3.2.1 High production costs of metamaterials
3.2.2 Limited awareness and understanding among end-users
3.2.3 Regulatory hurdles in material approvals
3.2.4 Competition from traditional materials
3.3 Market Opportunities
3.3.1 Development of new applications in defense and aerospace
3.3.2 Collaborations with tech companies for product innovation
3.3.3 Expansion into emerging markets
3.3.4 Integration of metamaterials in renewable energy solutions
3.4 Market Trends
3.4.1 Increasing adoption of metamaterials in consumer electronics
3.4.2 Advancements in 3D printing technologies for metamaterials
3.4.3 Focus on sustainability and eco-friendly materials
3.4.4 Growth of smart materials in various industries
3.5 Government Regulation
3.5.1 Standards for material safety and performance
3.5.2 Incentives for R&D in advanced materials
3.5.3 Environmental regulations impacting production processes
3.5.4 Trade policies affecting import/export of materials
4. SWOT Analysis
5. Stakeholder Analysis
6. Porter's Five Forces Analysis
7. APAC Metamaterials Market Market Size, 2019-2024
7.1 By Value
7.2 By Volume
7.3 By Average Selling Price
8. APAC Metamaterials Market Segmentation
8.1 By Type
8.1.1 Electromagnetic Metamaterials
8.1.2 Acoustic Metamaterials
8.1.3 Optical Metamaterials
8.1.4 Terahertz Metamaterials
8.1.5 Mechanical/Structural Metamaterials
8.1.6 Others
8.2 By End-User
8.2.1 Telecommunications
8.2.2 Healthcare & Medical Devices
8.2.3 Aerospace & Defense
8.2.4 Automotive & Transportation
8.2.5 Consumer Electronics
8.2.6 Energy & Power
8.2.7 Others
8.3 By Region
8.3.1 China
8.3.2 Japan
8.3.3 South Korea
8.3.4 India
8.3.5 Rest of Asia-Pacific
8.4 By Technology
8.4.1 3D Printing/Additive Manufacturing
8.4.2 Nano-fabrication
8.4.3 Lithography
8.4.4 Laser Processing
8.4.5 Others
8.5 By Application
8.5.1 Antennas & Radars
8.5.2 Telecommunications Infrastructure
8.5.3 Medical Imaging & Sensors
8.5.4 Energy Harvesting
8.5.5 Optical Devices (e.g., AR/VR, Lenses)
8.5.6 Cloaking Devices
8.5.7 Others
8.6 By Investment Source
8.6.1 Private Investments
8.6.2 Government Funding
8.6.3 Venture Capital
8.6.4 Corporate R&D
8.6.5 Others
8.7 By Policy Support
8.7.1 Research Grants
8.7.2 Tax Incentives
8.7.3 Subsidies for R&D
8.7.4 Standards & Certification Programs
8.7.5 Others
9. APAC Metamaterials Market Competitive Analysis
9.1 Market Share of Key Players
9.2 Cross Comparison of Key Players
9.2.1 Company Name
9.2.2 Group Size (Large, Medium, or Small as per industry convention)
9.2.3 Revenue (USD, latest fiscal year)
9.2.4 Revenue Growth Rate (3-year CAGR)
9.2.5 Market Penetration Rate (APAC share, %)
9.2.6 R&D Expenditure (% of revenue)
9.2.7 Number of Patents/Patent Families (APAC region)
9.2.8 Product Portfolio Breadth (No. of APAC-relevant product lines)
9.2.9 Key End-User Segments Served
9.2.10 Strategic Partnerships/Collaborations (APAC)
9.2.11 Manufacturing Footprint (No. of APAC facilities)
9.2.12 Return on Investment (ROI)
9.2.13 Customer Satisfaction Score (APAC, if available)
9.3 SWOT Analysis of Top Players
9.4 Pricing Analysis
9.5 Detailed Profile of Major Companies
9.5.1 Meta Materials Inc. (Canada, active in APAC)
9.5.2 Nanoscribe GmbH (BICO Group, Germany, APAC presence)
9.5.3 Kymeta Corporation (USA, APAC distribution)
9.5.4 Echodyne Corp. (USA, APAC partnerships)
9.5.5 Advanced Fiber Resources (Zhuhai), Ltd. (China)
9.5.6 Zhejiang Hisun Advanced Materials Co., Ltd. (China)
9.5.7 TeraView Ltd. (UK, APAC operations)
9.5.8 Lightwave Logic, Inc. (USA, APAC sales)
9.5.9 Aether Industries Limited (India)
9.5.10 Murata Manufacturing Co., Ltd. (Japan)
9.5.11 NEC Corporation (Japan)
9.5.12 Samsung Electro-Mechanics (South Korea)
9.5.13 Panasonic Corporation (Japan)
9.5.14 TDK Corporation (Japan)
9.5.15 Shenzhen Kuang-Chi Advanced Technology Co., Ltd. (China)
10. APAC Metamaterials Market End-User Analysis
10.1 Procurement Behavior of Key Ministries
10.1.1 Government procurement policies
10.1.2 Budget allocation for advanced materials
10.1.3 Collaboration with private sector
10.1.4 Evaluation criteria for suppliers
10.2 Corporate Spend on Infrastructure & Energy
10.2.1 Investment trends in infrastructure projects
10.2.2 Energy efficiency initiatives
10.2.3 Adoption of innovative materials
10.2.4 Budgeting for sustainability
10.3 Pain Point Analysis by End-User Category
10.3.1 Challenges in material sourcing
10.3.2 Performance issues with existing materials
10.3.3 Cost constraints
10.3.4 Regulatory compliance difficulties
10.4 User Readiness for Adoption
10.4.1 Awareness of metamaterials
10.4.2 Training and education needs
10.4.3 Infrastructure readiness
10.4.4 Financial readiness for investment
10.5 Post-Deployment ROI and Use Case Expansion
10.5.1 Measurement of ROI post-implementation
10.5.2 Case studies of successful deployments
10.5.3 Scalability of applications
10.5.4 Future use case identification
11. APAC Metamaterials Market Future Size, 2025-2030
11.1 By Value
11.2 By Volume
11.3 By Average Selling Price
Go-To-Market Strategy Phase
1. Whitespace Analysis + Business Model Canvas
1.1 Market gaps identification
1.2 Business model development
2. Marketing and Positioning Recommendations
2.1 Branding strategies
2.2 Product USPs
3. Distribution Plan
3.1 Urban retail vs rural NGO tie-ups
4. Channel & Pricing Gaps
4.1 Underserved routes
4.2 Pricing bands
5. Unmet Demand & Latent Needs
5.1 Category gaps
5.2 Consumer segments
6. Customer Relationship
6.1 Loyalty programs
6.2 After-sales service
7. Value Proposition
7.1 Sustainability
7.2 Integrated supply chains
8. Key Activities
8.1 Regulatory compliance
8.2 Branding
8.3 Distribution setup
9. Entry Strategy Evaluation
9.1 Domestic Market Entry Strategy
9.1.1 Product mix
9.1.2 Pricing band
9.1.3 Packaging
9.2 Export Entry Strategy
9.2.1 Target countries
9.2.2 Compliance roadmap
10. Entry Mode Assessment
10.1 JV
10.2 Greenfield
10.3 M&A
10.4 Distributor Model
11. Capital and Timeline Estimation
11.1 Capital requirements
11.2 Timelines
12. Control vs Risk Trade-Off
12.1 Ownership vs Partnerships
13. Profitability Outlook
13.1 Breakeven analysis
13.2 Long-term sustainability
14. Potential Partner List
14.1 Distributors
14.2 JVs
14.3 Acquisition targets
15. Execution Roadmap
15.1 Phased Plan for Market Entry
15.1.1 Market Setup
15.1.2 Market Entry
15.1.3 Growth Acceleration
15.1.4 Scale & Stabilize
15.2 Key Activities and Milestones
15.2.1 Milestone tracking
15.2.2 Activity scheduling
Research Methodology
Phase 1: Approach1
Desk Research
- Industry reports from leading market research firms focusing on metamaterials
- Academic journals and publications detailing advancements in metamaterial technologies
- Government publications and white papers on the regulatory landscape affecting the metamaterials market in APAC
Primary Research
- Interviews with R&D heads at universities and research institutions specializing in metamaterials
- Surveys with product managers from companies utilizing metamaterials in their applications
- Field interviews with engineers and technical experts involved in metamaterial development
Validation & Triangulation
- Cross-validation of findings through multiple data sources including trade publications and expert opinions
- Triangulation of market data with insights from industry conferences and symposiums
- Sanity checks through feedback from a panel of industry experts and stakeholders
Phase 2: Market Size Estimation1
Top-down Assessment
- Analysis of the overall materials market in APAC to identify the share of metamaterials
- Segmentation by application areas such as telecommunications, healthcare, and defense
- Incorporation of macroeconomic indicators and technology adoption rates in the region
Bottom-up Modeling
- Estimation of production capacities and sales volumes from key metamaterial manufacturers
- Cost analysis based on raw materials and manufacturing processes specific to metamaterials
- Volume x price calculations to derive revenue estimates for different market segments
Forecasting & Scenario Analysis
- Multi-variable forecasting models incorporating technological advancements and market trends
- Scenario analysis based on potential regulatory changes and market entry of new players
- Development of baseline, optimistic, and pessimistic forecasts through 2030
Phase 3: CATI Sample Composition1
| Scope Item/Segment | Sample Size | Target Respondent Profiles |
|---|---|---|
| Telecommunications Applications | 50 | Product Development Managers, Network Engineers |
| Healthcare Imaging Technologies | 40 | Medical Device Engineers, Radiology Specialists |
| Defense and Security Solutions | 40 | Defense Contractors, Security Technology Experts |
| Consumer Electronics Integration | 45 | Product Managers, Electronics Engineers |
| Energy Harvesting Applications | 40 | Renewable Energy Engineers, Sustainability Managers |
Frequently Asked Questions
What is the current value of the APAC Metamaterials Market?
The APAC Metamaterials Market is valued at approximately USD 1.4 billion, driven by advancements in telecommunications, consumer electronics, and healthcare applications. This growth is supported by significant investments in research and development across key countries like China, Japan, and South Korea.
What are the main drivers of growth in the APAC Metamaterials Market?
Which countries are leading in the APAC Metamaterials Market?
What types of metamaterials are prevalent in the APAC market?
Other Regional/Country Reports
Indonesia Metamaterials Market
Malaysia Metamaterials Market
KSA Metamaterials Market
SEA Metamaterials Market
Vietnam Metamaterials Market
Thailand Metamaterials Market
Other Adjacent Reports
Qatar Telecommunications Market
New Zealand Consumer Electronics Market Size Share Growth Drivers Trends Opportunities & Forecast 2025–2030Poland Medical Devices MarketChina Aerospace Market Outlook to 2030Indonesia Defense MarketIndia Automotive Market (2023-2029Germany Energy Market
UAE Photonics MarketQatar Acoustics Market
Saudi Arabia Nanotechnology Market Report Size, Share, Growth Drivers, Trends, Opportunities & Forecast 2025–2030Why Buy From Us?

What makes us stand out is that our consultants follow Robust, Refine and Result (RRR) methodology. Robust for clear definitions, approaches and sanity checking, Refine for differentiating respondents' facts and opinions, and Result for presenting data with story.

We have set a benchmark in the industry by offering our clients with syndicated and customized market research reports featuring coverage of entire market as well as meticulous research and analyst insights.

While we don't replace traditional research, we flip the method upside down. Our dual approach of Top Bottom & Bottom Top ensures quality deliverable by not just verifying company fundamentals but also looking at the sector and macroeconomic factors.

With one step in the future, our research team constantly tries to show you the bigger picture. We help with some of the tough questions you may encounter along the way: How is the industry positioned? Best marketing channel? KPI's of competitors? By aligning every element, we help maximize success.

Our report gives you instant access to the answers and sources that other companies might choose to hide. We elaborate each steps of research methodology we have used and showcase you the sample size to earn your trust.

If you need any support, we are here! We pride ourselves on universe strength, data quality, and quick, friendly, and professional service.