CHAPTER 1 - MARKET SUMMARY
Market Overview
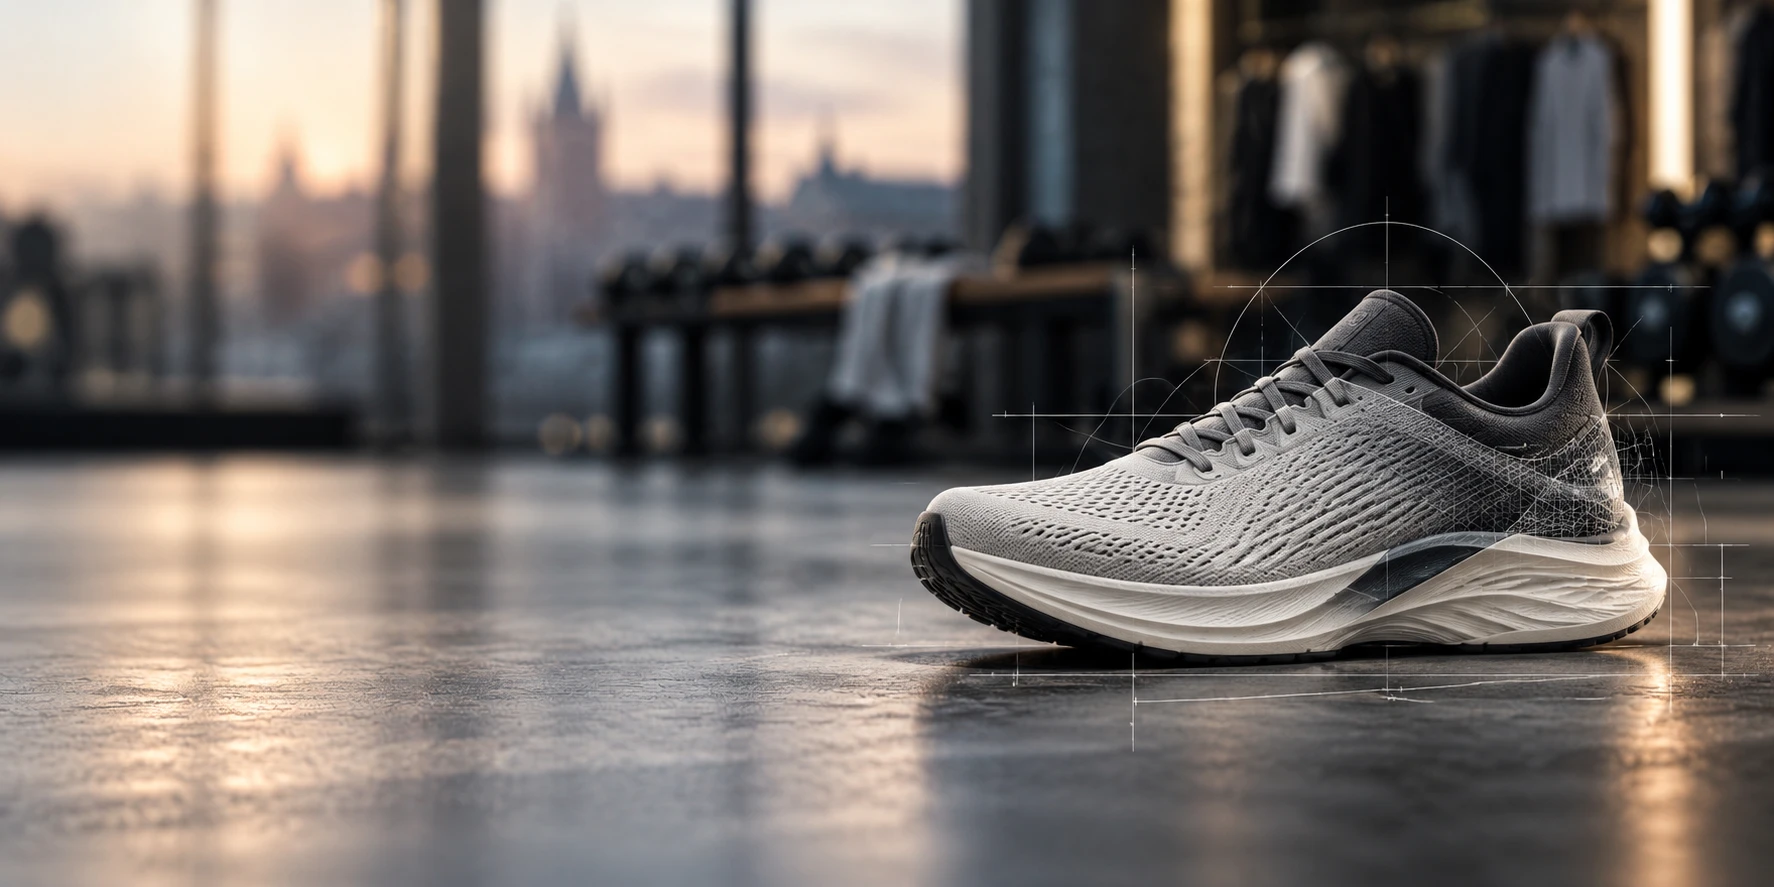
The Poland Sports Apparel & Athleisure Market operates at the intersection of performance sportswear, athletic footwear and sports-inspired everyday clothing. Demand is increasingly supported by a broader active population: sports and recreational participation increased from 38.8% in 2021 to 43.7% in 2025. Higher participation expands repeat purchasing across running, fitness, football and outdoor categories rather than relying only on fashion replacement cycles.
Demand and premium retail capacity are concentrated around Warsaw and other large urban centres including Krakow, Wroclaw, Poznan and the Upper Silesian metropolitan area. In 2024, average household expenditure in Polish urban areas was 36.6% higher than in rural households. The spending differential makes major cities the preferred locations for flagship stores, premium assortments, specialist running concepts and omnichannel fulfilment infrastructure.
Market Value
USD 2,700 million
2025
Dominant Region
Central Poland, led by Warsaw and Mazowieckie
Dominant Segment
Performance Sportswear
fastest growing: Athleisure Apparel
Total Number of Players
150+
Future Outlook
The Poland Sports Apparel & Athleisure Market is projected to expand from USD 2,700 million in 2025 to USD 4,023 million by 2032. The resulting forecast CAGR is 5.86%, compared with an estimated 6.72% historical CAGR during 2020-2025. Growth is expected to become more volume-balanced as inflation normalizes, with gains increasingly generated by participation-driven replacement demand, women's performance categories, running footwear, outdoor apparel and sports-inspired everyday wardrobes. Digital commerce will remain strategically important, but successful brands will increasingly combine marketplaces with direct e-commerce and physical stores to protect brand positioning, conversion rates and customer data ownership.
Volume is projected to increase from approximately 60.0 million equivalent retail units in 2025 to 74.8 million units by 2032, while modeled average selling value increases from USD 45.00 to USD 53.78 per equivalent unit. This implies that both penetration and premiumization contribute to value growth. Regulatory changes around textile traceability, circularity and product safety will raise operating requirements but also create differentiation opportunities for brands with strong materials data and responsible sourcing systems. The principal downside risks are promotional intensity, slower discretionary spending and cross-border online price competition, while higher participation and faster athleisure adoption provide upside potential.
5.86%
Forecast CAGR
$4,023 Mn
2030 Projection
Base Year
2025
Historical Period
2020-2025
Forecast Period
2025-2032
Historical CAGR
6.72%
CHAPTER 2 - SCOPE OF REPORT
Scope of the Market
CHAPTER 3 - Key Stakeholders
Key Target Audience
Key stakeholders who can leverage from this market analysis for investment, strategy, and operational planning.
Investors
CAGR, brand equity, margins, digital mix, inventory turns, risk
Corporates
category growth, pricing, channel mix, assortment, localization, sourcing
Government
participation, consumer safety, textile circularity, imports, compliance, employment
Operators
sell-through, inventory turns, DTC mix, returns, conversion, replenishment
Financial institutions
cash conversion, working capital, margins, demand stability, covenants
CHAPTER 4 - Market Size & Growth
Market Size, Growth Forecast and Trends
This section evaluates the historical market size, analyzes year-over-year growth dynamics, and presents forecast projections supported by market performance indicators and demand-side drivers.
Historical & Projected Market Size ($ Million)
Year-over-Year Growth Rate (%)
Market Value vs Volume Growth (%)
Historical Market Performance (2020-2025)
Historical value expanded at an estimated 6.72% CAGR, with 2023 representing the slowest annual expansion at 4.44% before acceleration to 8.00% in 2025. The improvement corresponds with stronger household purchasing power and a wider active-consumer base. Statistics Poland recorded sport and recreational participation at 38.8% in 2021 compared with 43.7% in 2025, supporting higher recurring demand for training apparel, footwear and sports-inspired casual products.
Forecast Market Outlook (2025-2032)
The modeled forecast closes at USD 4,023 million in 2032, mathematically reconciling to a 5.86% CAGR from 2025. Equivalent unit volume reaches approximately 74.8 million, while average selling value rises to USD 53.78. The triangulated 2025 confidence band is approximately USD 2,460-2,940 million, implying an approximate plus or minus 9% sizing range, primarily driven by category boundary, marketplace sales and sports-inspired apparel classification assumptions.
CHAPTER 5 - Market Data
Market Breakdown
Poland's sports apparel and athleisure growth is shifting from predominantly price-led expansion toward a combination of unit penetration, premium technical products and digital channel productivity. For CEOs and investors, the key issue is whether brands can grow direct consumer relationships while maintaining wholesale reach and disciplined inventory economics.
Year | Market Size (USD Mn) | YoY Growth (%) | Equivalent Retail Units (Mn) | Average Selling Value (USD/Unit) | Modeled Digital Channel Share (%) | Period |
|---|---|---|---|---|---|---|
| 2020 | $1,950 Mn | +- | 49.0 | 39.80 | Forecast | |
| 2021 | $2,100 Mn | +7.69% | 51.0 | 41.18 | Forecast | |
| 2022 | $2,250 Mn | +7.14% | 53.5 | 42.06 | Forecast | |
| 2023 | $2,350 Mn | +4.44% | 54.7 | 42.96 | Forecast | |
| 2024 | $2,500 Mn | +6.38% | 57.0 | 43.86 | Forecast | |
| 2025 | $2,700 Mn | +8.00% | 60.0 | 45.00 | Forecast | |
| 2026 | $2,858 Mn | +5.85% | 61.9 | 46.17 | Forecast | |
| 2027 | $3,026 Mn | +5.88% | 63.9 | 47.36 | Forecast | |
| 2028 | $3,203 Mn | +5.85% | 65.9 | 48.60 | Forecast | |
| 2029 | $3,391 Mn | +5.87% | 68.1 | 49.79 | Forecast | |
| 2030 | $3,590 Mn | +5.87% | 70.2 | 51.14 | Forecast | |
| 2031 | $3,800 Mn | +5.85% | 72.5 | 52.41 | Forecast | |
| 2032 | $4,023 Mn | +5.87% | 74.8 | 53.78 | Forecast |
Equivalent Retail Units
60.0 million units, 2025, Poland. Volume expansion depends on converting occasional consumers into repeat sport and athleisure buyers. Sports participation reached 43.7% in 2025, increasing the addressable replacement cycle.
Average Selling Value
USD 45.00 per equivalent unit, 2025, Poland. Premiumization is strongest in technical footwear and performance fabrics. Urban household expenditure was 36.6% higher than rural expenditure in 2024, supporting higher-value assortments in large cities.
Digital Channel Share
40%, 2025, Poland, modeled. Digital discovery is structurally important for sportswear. Across the EU, 70% of consumers who had recently shopped online purchased clothes, shoes or accessories in 2024.
CHAPTER 6 - Segmentation
Market Segmentation Framework
Comprehensive analysis across key dimensions providing insights into market structure, consumer preferences, and distribution patterns.
No of Segments
7
Dominant Segment
Product Type
Fastest Growing Segment
Distribution Channel
Product Type
Application
End User
Technology
Price Tier
Distribution Channel
Geography
Key Segmentation Takeaways
Comprehensive analysis across all extracted segmentation dimensions providing insights into market structure, consumer preferences, and distribution patterns.
Product Type
Performance sportswear remains the core revenue pool because it serves football, fitness, running and everyday active use, while athletic footwear provides a higher average ticket. Athleisure apparel is narrowing the boundary between technical clothing and casual fashion, increasing wardrobe penetration and giving sports brands more opportunities to monetize consumers outside formal sporting occasions.
Distribution Channel
E-commerce marketplaces and brand-owned digital channels are forecast to gain share fastest as consumers compare price, technical attributes and inventory availability online. Brand DTC stores remain strategically valuable for premium launches and consumer experience, while sporting goods chains continue to provide broad national reach. The winning channel architecture is therefore increasingly omnichannel rather than digital-only.
CHAPTER 7 - Regional Analysis
Regional Analysis
Poland is modeled as the second-largest sports apparel and athleisure opportunity within a selected Central and Eastern European peer set after Germany. Its scale benefits from a large domestic population, increasing physical participation and a mature digital retail ecosystem, while lower purchasing power than Germany keeps significant demand concentrated in value and mid-market tiers.
Focus Country Ranking
2nd
Focus Country Market Size
USD 2,700 Mn
Poland CAGR (2025-2032)
5.86%
Focus Country Ranking
2nd
Focus Country Market Size
USD 2,700 Mn
Poland CAGR (2025-2032)
5.86%
Regional Analysis (Current Year)
Market Position
Poland ranks second in the selected peer set, supported by a 2025 market anchor of USD 2,700 million and substantially greater consumer scale than Czechia or Hungary.
Growth Advantage
Poland's reconciled 5.86% forecast CAGR exceeds Germany's reported 4.2% sportswear outlook, positioning Poland as a higher-growth but less mature consumer opportunity within Central Europe.
Competitive Strengths
Poland combines 43.7% sport participation with a large omnichannel retail base; national e-commerce was approximately USD 25 billion in 2024, supporting scalable digital customer acquisition.
CHAPTER 8 - INDUSTRY ANALYSIS
Growth Drivers, Challenges & Opportunities
Comprehensive analysis of key factors shaping the Poland Sports Apparel & Athleisure Market, including growth catalysts, operational challenges, and emerging opportunities across production, distribution, and consumer segments.
Growth Drivers
Expanding Sports and Recreation Participation
- Participation increased from 38.8% (2021, Poland) to 43.7% in 2025, expanding the addressable population for replacement purchases rather than relying solely on fashion-led buying.
- Female participation reached 41.5% (2025, Poland), supporting dedicated women's running, training, leggings and studio-fitness assortments across both performance and athleisure price tiers.
- Male participation reached 46.1% (2025, Poland), sustaining demand in football, running, training and outdoor categories where international sports brands possess strong technical positioning.
Improving Household Purchasing Capacity
- Real household expenditure increased by 10.8% (2024, Poland), supporting discretionary retail categories after the earlier inflation shock and improving full-price conversion potential.
- Urban household expenditure was 36.6% higher (2024, Poland) than rural expenditure, reinforcing Warsaw, Krakow, Wroclaw and other major cities as the primary premium sportswear profit pools.
- The highest-income 20% of households captured 38.2% of household income (2024, Poland), sustaining a meaningful premium customer cohort for technical footwear and high-specification apparel.
Omnichannel and E-commerce Expansion
- E-commerce is expected to reach approximately USD 52 billion (2028, Poland), creating infrastructure and consumer-behaviour tailwinds for sportswear marketplaces and direct brand sites.
- Clothes, shoes and accessories represented purchases by 70% of recent online shoppers (2024, EU), confirming apparel as a core e-commerce category rather than a niche digital purchase.
- EU online buyer penetration reached 78% of internet users (2025, EU), reinforcing long-term consumer acceptance of online ordering and reducing structural barriers to digital sportswear penetration.
Market Challenges
Promotional Intensity and Margin Pressure
- PUMA sales declined 13.1% (2025, global), demonstrating how wholesale resets and weaker discretionary demand can force brands to rebalance volume against brand equity.
- NIKE gross margin contracted 190 basis points (FY2025, global), partly reflecting discounting and inventory obsolescence, risks that are particularly relevant in competitive multi-brand markets.
- NIKE Direct revenue declined 13% (FY2025, global), showing that owning the consumer channel does not by itself protect sales when assortment, pricing and inventory productivity weaken.
Consumer Price Sensitivity
- January-March retail sales increased only 1.4% YoY (2025, Poland), limiting the scope for indiscriminate price increases and increasing the importance of differentiated product innovation.
- Clothing and footwear prices declined 1.5% month-on-month (February 2025, Poland), reflecting competitive pricing conditions and creating margin pressure for undifferentiated brands.
- Consumer choice is widened by cross-border marketplaces as EU e-commerce penetration continues to rise, increasing price transparency and reducing switching costs for comparable products across 27 EU member states (2025, EU).
Increasing Product and Sustainability Compliance
- Regulation (EU) No 1007/2011 (EU) requires compliant textile fibre naming and composition information, making product-data accuracy a market-access requirement for apparel suppliers.
- The Ecodesign for Sustainable Products Regulation entered into force in July 2024 (EU), creating a framework for future durability, circularity and product-information requirements affecting textile brands.
- The Digital Product Passport Registry became operational on 20 July 2026 (EU), increasing the strategic importance of SKU-level materials, sourcing and sustainability data for textile companies.
Market Opportunities
Women's Performance and Athleisure Penetration
- The 4.6 percentage-point gender participation gap (2025, Poland) creates a monetizable opportunity in beginner-friendly running, fitness and athleisure ranges designed around female fit and usage.
- Brands that improve women's fit, technical features and styling can address an audience representing 41.5% participation (2025, Poland) while increasing cross-category purchasing between performance and lifestyle products.
- Conversion requires stronger community activation, fit consistency and localized merchandising because female participation remains below men's 46.1% level (2025, Poland), indicating different engagement and product-development requirements.
Direct Digital Consumer Relationships
- Brand-owned commerce can capture customer data and reduce marketplace dependence as Poland's total e-commerce market advances toward USD 52 billion (2028, Poland).
- Investors and operators benefit when DTC raises repeat-purchase visibility and supports full-price launches; PUMA's DTC share reached 32.4% of sales (2025, global).
- Execution requires integrated inventory and delivery infrastructure; the opportunity grows as online shopping reaches 78% of EU internet users (2025, EU).
Circular and Traceable Sportswear
- Recycled fibres, repairability and durability create monetizable differentiation as EU policy targets a more circular textile system by 2030 (EU).
- Brands with traceable sourcing benefit because textile apparel is a priority product group under ESPR (2026, EU) for Digital Product Passport implementation.
- Operational change requires product data, supplier traceability and circular design systems as member states have been required to establish separate textile collection streams from 2025 (EU).
CHAPTER 9 - Competitive Landscape
Competitive Landscape Overview
The market combines large multinational sports brands with a strong Polish champion, broad sporting-goods retail and a fragmented long tail, creating high brand-intensity but moderate structural entry barriers for digitally led niche labels.
Market Share Distribution
Top 5 Players
Market Dynamics
8 new entrants in the past 5 years, indicating strong market attractiveness and growth potential.
Company Name | Market Share | Headquarters | Founding Year | Core Market Focus |
|---|---|---|---|---|
adidas AG | - | Herzogenaurach, Germany | 1949 | Performance footwear, football, training and sports-inspired apparel |
Nike, Inc. | - | Beaverton, Oregon, USA | 1964 | Performance footwear, running, training and lifestyle sportswear |
PUMA SE | - | Herzogenaurach, Germany | 1948 | Football, running, sportstyle footwear and apparel |
OTCF S.A. (4F) | - | Poland | 1995 | Sportswear, footwear, accessories and athleisure |
Decathlon S.A. | - | France | 1976 | Multi-sport apparel, footwear and private-label performance products |
New Balance Athletics, Inc. | - | Boston, Massachusetts, USA | 1906 | Running footwear, performance apparel and lifestyle footwear |
ASICS Corporation | - | Kobe, Japan | 1949 | Running footwear, technical sportswear and performance products |
Under Armour, Inc. | - | Baltimore, Maryland, USA | 1996 | Training apparel, performance fabrics and athletic footwear |
Columbia Sportswear Company | - | Portland, Oregon, USA | 1938 | Outdoor performance apparel, footwear and technical layering |
The North Face (VF Corporation) | - | Denver, Colorado, USA | 1966 | Outdoor performance apparel, footwear and technical equipment |
Cross Comparison Parameters
The report provides detailed cross-comparison of key players across 10 performance parameters to identify competitive strengths and weaknesses.
Poland Retail Door Coverage
Digital Channel Mix
Poland Sportswear Revenue Growth
Gross Margin
Analysis Covered
Market Share Analysis:
Evaluates revenue concentration across global, domestic and specialist sportswear brands.
Cross Comparison Matrix:
Benchmarks commercial scale, channels, growth and margin performance systematically.
SWOT Analysis:
Assesses brand strength, channel exposure, innovation and execution vulnerabilities.
Pricing Strategy Analysis:
Compares value, mid-market, premium and performance-led price architectures across players.
Company Profiles:
Profiles positioning, geographic presence, product focus and strategic capabilities individually.
CHAPTER 10 - REPORT TOC
Table of Contents
Market Assessment Phase
Supply-side and competitive intelligence covering market sizing, segmentation, competitive dynamics, regulatory landscape, and future forecasts.
Go-To-Market Strategy Phase
15 chapters
Entry strategy evaluation, execution roadmap, partner recommendations, and profitability outlook.
Survey Phase
8 chapters
Demand-side primary research conducted through structured interviews and online surveys with end users across priority metros and Tier 2/3 cities to capture consumption behavior, unmet needs, and purchase drivers.
Complete Report Coverage
201+ detailed sections covering every aspect of the market
143
Assessment Sections
58
Strategy Sections
CHAPTER 11 - Our Approach
Research Methodology
Desk Research
- Analyze Polish sports participation statistics
- Map apparel retail channel structure
- Review sportswear company financial disclosures
- Track EU textile compliance regulation
Primary Research
- Interview sportswear country sales directors
- Interview sporting-goods category managers
- Interview e-commerce merchandising managers
- Interview sports retail operations directors
Validation and Triangulation
- Validate findings across 350 respondents
- Cross-check brand and retailer volumes
- Reconcile channel and category sales
- Test implied per-capita consumption levels
CHAPTER 12 - FAQ
FAQs
Still have questions?
Our research team is here to help you find the right solution
CHAPTER 13 - Related Research
Explore Related Reports
Expand your market intelligence with complementary research across regions and adjacent markets.
Regional/Country ReportsRelated market analysis across key regions
Related market analysis across key regions
Adjacent ReportsRelated markets and complementary research
Related markets and complementary research
- Europe Athletic Footwear Market Size, Share & Forecast, By Product Type, End User & Distribution Channel, 2026-2031
- Egypt Fitness Equipment Market Size, Share & Forecast, By Product Type, End User & Distribution Channel, 2026–2032
- Global Outdoor Apparel Market Size, Share & Forecast, By Product Type, Activity Type, End User & Distribution Channel, 2026-2031
- Brazil Sports Accessories Market
- Germany Active Lifestyle Products Market
500+
Market Research Reports
50+
Countries Covered
15+
Industry Verticals