About the Report
Base Year 2024UAE Food Delivery Apps Market Overview
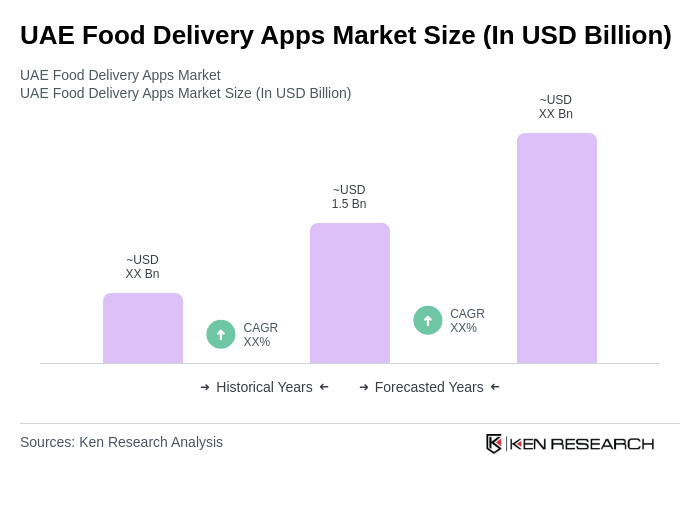
- The UAE Food Delivery Apps Market is valued at USD 1.5 billion, based on a five-year historical analysis. This growth is primarily driven by the increasing adoption of smartphones, the rise of e-commerce, and changing consumer preferences towards convenience and quick service. The market has seen a significant uptick in demand as more consumers opt for online food ordering, especially during the pandemic.
- Dubai and Abu Dhabi are the dominant cities in the UAE Food Delivery Apps Market due to their high population density, affluent consumer base, and a vibrant food culture. The presence of numerous restaurants and a growing expatriate community further fuel the demand for food delivery services, making these cities key players in the market.
- In 2023, the UAE government implemented regulations to enhance food safety standards in the food delivery sector. This includes mandatory compliance with health and safety protocols for delivery personnel and restaurants, aimed at ensuring consumer safety and maintaining high-quality service standards across the industry.
UAE Food Delivery Apps Market Segmentation
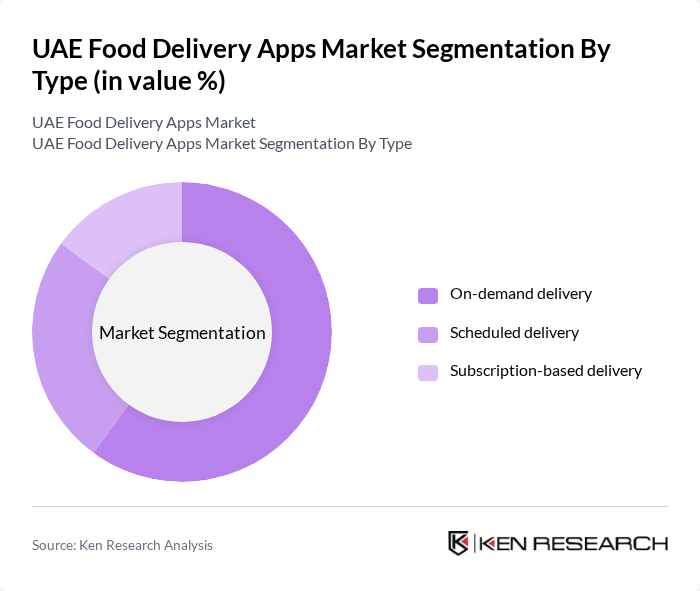
By Type:The market is segmented into three main types: on-demand delivery, scheduled delivery, and subscription-based delivery. On-demand delivery is the most popular segment, driven by consumer preference for immediate service. Scheduled delivery allows consumers to plan their meals in advance, while subscription-based delivery offers convenience for regular users. The on-demand delivery segment is expected to dominate due to its alignment with the fast-paced lifestyle of consumers.
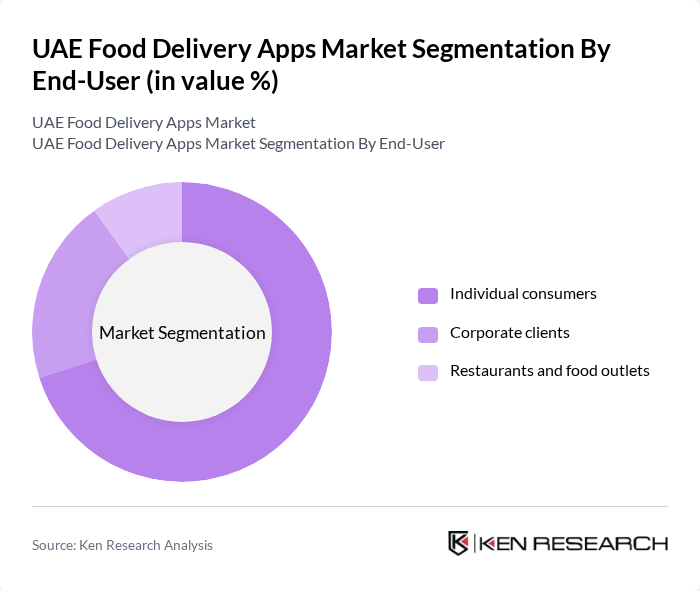
By End-User:The end-user segmentation includes individual consumers, corporate clients, and restaurants and food outlets. Individual consumers represent the largest segment, driven by the growing trend of online food ordering among households. Corporate clients utilize food delivery services for business meetings and events, while restaurants and food outlets leverage these platforms to expand their reach. The individual consumer segment leads the market due to the increasing number of people opting for convenience in their dining choices.
UAE Food Delivery Apps Market Competitive Landscape
The UAE Food Delivery Apps Market is characterized by a dynamic mix of regional and international players. Leading participants such as Talabat, Deliveroo, Zomato, Uber Eats, Noon Food, Foodonclick, Carriage, Eat App, Fatafeat, Just Eat, GoFood, Munchbox, Food Delivery UAE, Crave, ChefXChange contribute to innovation, geographic expansion, and service delivery in this space.
UAE Food Delivery Apps Market Industry Analysis
Growth Drivers
- Increasing Smartphone Penetration:The UAE boasts a smartphone penetration rate of approximately 98% in future, according to the Telecommunications Regulatory Authority. This high level of smartphone usage facilitates easy access to food delivery apps, driving user engagement. With over 9 million smartphone users in the UAE, the convenience of ordering food through mobile applications is becoming a standard practice, significantly contributing to the growth of the food delivery market.
- Rising Demand for Convenience:The UAE's fast-paced lifestyle has led to a growing demand for convenience, with 70% of consumers preferring food delivery services over traditional dining options. This trend is particularly pronounced among the urban population, where busy schedules and a high disposable income encourage the use of food delivery apps. The convenience factor is further amplified by the increasing availability of diverse cuisines, catering to the preferences of a multicultural society.
- Expansion of Restaurant Partnerships:In future, food delivery apps in the UAE have partnered with over 5,000 restaurants, a significant increase from previous years. This expansion allows consumers to access a wider variety of dining options, enhancing the appeal of food delivery services. The collaboration with local eateries and international chains not only boosts app visibility but also meets the growing consumer demand for diverse culinary experiences, driving market growth.
Market Challenges
- Intense Competition Among Apps:The UAE food delivery market is characterized by fierce competition, with over 15 major players vying for market share. This saturation leads to aggressive pricing strategies and promotional offers, which can erode profit margins. As companies strive to differentiate themselves, the constant need for innovation and customer engagement becomes a significant challenge, impacting overall market stability and growth.
- Delivery Logistics and Costs:Efficient delivery logistics remain a critical challenge, with operational costs rising due to fuel price fluctuations and labor expenses. In future, the average delivery cost per order is estimated at AED 10, which can deter price-sensitive consumers. Additionally, managing timely deliveries while maintaining quality service is essential for customer satisfaction, making logistics a complex issue for food delivery apps in the UAE.
UAE Food Delivery Apps Market Future Outlook
The UAE food delivery apps market is poised for continued evolution, driven by technological advancements and changing consumer preferences. As urbanization increases, the demand for efficient and diverse food delivery options will likely rise. Companies are expected to invest in AI and data analytics to enhance customer experiences and streamline operations. Furthermore, sustainability initiatives will play a crucial role in shaping the market, as consumers increasingly favor eco-friendly practices in food delivery services.
Market Opportunities
- Expansion into Underserved Areas:There is a significant opportunity for food delivery apps to expand into underserved regions of the UAE, where demand for delivery services is growing. With a population of over 1 million in areas like Ajman and Fujairah, tapping into these markets can lead to increased user acquisition and revenue growth, as residents seek convenient dining options.
- Integration of AI for Personalized Services:Leveraging AI technology to offer personalized recommendations can enhance user engagement and satisfaction. By analyzing consumer behavior and preferences, food delivery apps can tailor their offerings, leading to higher retention rates. This strategic integration can significantly improve customer loyalty and drive repeat business, positioning companies favorably in a competitive landscape.
Scope of the Report
| Segment | Sub-Segments |
|---|---|
| By Type | On-demand delivery Scheduled delivery Subscription-based delivery |
| By End-User | Individual consumers Corporate clients Restaurants and food outlets |
| By Cuisine Type | Fast food Asian cuisine Middle Eastern cuisine Vegetarian and vegan options |
| By Delivery Method | In-house delivery Third-party delivery |
| By Payment Method | Credit/debit cards Digital wallets Cash on delivery |
| By Customer Demographics | Age groups Income levels Urban vs rural |
Key Target Audience
Investors and Venture Capitalist Firms
Government and Regulatory Bodies (e.g., Ministry of Economy, Dubai Department of Economic Development)
Food and Beverage Manufacturers
Logistics and Supply Chain Companies
Restaurant Chains and Franchises
Payment Processing Companies
Telecommunications Providers
Advertising and Marketing Agencies
Players Mentioned in the Report:
Talabat
Deliveroo
Zomato
Uber Eats
Noon Food
Foodonclick
Carriage
Eat App
Fatafeat
Just Eat
GoFood
Munchbox
Food Delivery UAE
Crave
ChefXChange
Table of Contents
Market Assessment Phase
1. Executive Summary and Approach
2. UAE Food Delivery Apps Market Overview
2.1 Key Insights and Strategic Recommendations
2.2 UAE Food Delivery Apps Market Overview
2.3 Definition and Scope
2.4 Evolution of Market Ecosystem
2.5 Timeline of Key Regulatory Milestones
2.6 Value Chain & Stakeholder Mapping
2.7 Business Cycle Analysis
2.8 Policy & Incentive Landscape
3. UAE Food Delivery Apps Market Analysis
3.1 Growth Drivers
3.1.1 Increasing smartphone penetration
3.1.2 Rising demand for convenience
3.1.3 Expansion of restaurant partnerships
3.1.4 Growth in urban population
3.2 Market Challenges
3.2.1 Intense competition among apps
3.2.2 Regulatory hurdles
3.2.3 Delivery logistics and costs
3.2.4 Customer retention issues
3.3 Market Opportunities
3.3.1 Expansion into underserved areas
3.3.2 Integration of AI for personalized services
3.3.3 Partnerships with local businesses
3.3.4 Introduction of subscription models
3.4 Market Trends
3.4.1 Increased focus on sustainability
3.4.2 Rise of ghost kitchens
3.4.3 Adoption of contactless delivery
3.4.4 Growth of meal kit services
3.5 Government Regulation
3.5.1 Licensing requirements for food delivery
3.5.2 Health and safety regulations
3.5.3 Data protection laws
3.5.4 Labor laws affecting delivery personnel
4. SWOT Analysis
5. Stakeholder Analysis
6. Porter's Five Forces Analysis
7. UAE Food Delivery Apps Market Market Size, 2019-2024
7.1 By Value
7.2 By Volume
7.3 By Average Selling Price
8. UAE Food Delivery Apps Market Segmentation
8.1 By Type
8.1.1 On-demand delivery
8.1.2 Scheduled delivery
8.1.3 Subscription-based delivery
8.2 By End-User
8.2.1 Individual consumers
8.2.2 Corporate clients
8.2.3 Restaurants and food outlets
8.3 By Cuisine Type
8.3.1 Fast food
8.3.2 Asian cuisine
8.3.3 Middle Eastern cuisine
8.3.4 Vegetarian and vegan options
8.4 By Delivery Method
8.4.1 In-house delivery
8.4.2 Third-party delivery
8.5 By Payment Method
8.5.1 Credit/debit cards
8.5.2 Digital wallets
8.5.3 Cash on delivery
8.6 By Customer Demographics
8.6.1 Age groups
8.6.2 Income levels
8.6.3 Urban vs rural
8.7 Others
9. UAE Food Delivery Apps Market Competitive Analysis
9.1 Market Share of Key Players
9.2 Cross Comparison of Key Players
9.2.1 Company Name
9.2.2 Group Size (Large, Medium, or Small as per industry convention)
9.2.3 Customer Acquisition Cost
9.2.4 Average Order Value
9.2.5 Delivery Time Efficiency
9.2.6 Customer Retention Rate
9.2.7 Market Penetration Rate
9.2.8 Pricing Strategy
9.2.9 User Engagement Metrics
9.2.10 Revenue Growth Rate
9.3 SWOT Analysis of Top Players
9.4 Pricing Analysis
9.5 Detailed Profile of Major Companies
9.5.1 Talabat
9.5.2 Deliveroo
9.5.3 Zomato
9.5.4 Uber Eats
9.5.5 Noon Food
9.5.6 Foodonclick
9.5.7 Carriage
9.5.8 Eat App
9.5.9 Fatafeat
9.5.10 Just Eat
9.5.11 GoFood
9.5.12 Munchbox
9.5.13 Food Delivery UAE
9.5.14 Crave
9.5.15 ChefXChange
10. UAE Food Delivery Apps Market End-User Analysis
10.1 Procurement Behavior of Key Ministries
10.1.1 Government contracts for food services
10.1.2 Budget allocation for food delivery
10.1.3 Evaluation criteria for service providers
10.2 Corporate Spend on Infrastructure & Energy
10.2.1 Investment in delivery infrastructure
10.2.2 Budget for technology integration
10.3 Pain Point Analysis by End-User Category
10.3.1 Delivery time issues
10.3.2 Quality of food upon delivery
10.3.3 Customer service responsiveness
10.4 User Readiness for Adoption
10.4.1 Familiarity with technology
10.4.2 Willingness to pay for convenience
10.5 Post-Deployment ROI and Use Case Expansion
10.5.1 Metrics for success evaluation
10.5.2 Opportunities for service expansion
11. UAE Food Delivery Apps Market Future Size, 2025-2030
11.1 By Value
11.2 By Volume
11.3 By Average Selling Price
Go-To-Market Strategy Phase
1. Whitespace Analysis + Business Model Canvas
1.1 Market gaps identification
1.2 Value proposition development
1.3 Revenue streams analysis
1.4 Cost structure evaluation
1.5 Key partnerships exploration
1.6 Customer segments definition
1.7 Channels for delivery
2. Marketing and Positioning Recommendations
2.1 Branding strategies
2.2 Product USPs
3. Distribution Plan
3.1 Urban retail vs rural NGO tie-ups
4. Channel & Pricing Gaps
4.1 Underserved routes
4.2 Pricing bands
5. Unmet Demand & Latent Needs
5.1 Category gaps
5.2 Consumer segments
6. Customer Relationship
6.1 Loyalty programs
6.2 After-sales service
7. Value Proposition
7.1 Sustainability
7.2 Integrated supply chains
8. Key Activities
8.1 Regulatory compliance
8.2 Branding
8.3 Distribution setup
9. Entry Strategy Evaluation
9.1 Domestic Market Entry Strategy
9.1.1 Product mix
9.1.2 Pricing band
9.1.3 Packaging
9.2 Export Entry Strategy
9.2.1 Target countries
9.2.2 Compliance roadmap
10. Entry Mode Assessment
10.1 JV
10.2 Greenfield
10.3 M&A
10.4 Distributor Model
11. Capital and Timeline Estimation
11.1 Capital requirements
11.2 Timelines
12. Control vs Risk Trade-Off
12.1 Ownership vs Partnerships
13. Profitability Outlook
13.1 Breakeven analysis
13.2 Long-term sustainability
14. Potential Partner List
14.1 Distributors
14.2 JVs
14.3 Acquisition targets
15. Execution Roadmap
15.1 Phased Plan for Market Entry
15.1.1 Market Setup
15.1.2 Market Entry
15.1.3 Growth Acceleration
15.1.4 Scale & Stabilize
15.2 Key Activities and Milestones
15.2.1 Activity timelines
15.2.2 Milestone tracking
Research Methodology
Phase 1: Approach1
Desk Research
- Analysis of market reports from industry associations and government publications related to food delivery services in the UAE
- Review of consumer behavior studies and trends in online food ordering from academic journals and market research firms
- Examination of demographic and economic data from the UAE National Bureau of Statistics to understand target market segments
Primary Research
- Interviews with key stakeholders including food delivery app executives, restaurant owners, and logistics managers
- Surveys conducted with consumers to gauge preferences, usage patterns, and satisfaction levels with existing food delivery services
- Focus group discussions with diverse demographic groups to explore attitudes towards food delivery apps and their features
Validation & Triangulation
- Cross-validation of findings through comparison with existing market data and consumer insights
- Triangulation of qualitative insights from interviews and focus groups with quantitative survey results
- Sanity checks performed by consulting industry experts to ensure the reliability of the data collected
Phase 2: Market Size Estimation1
Top-down Assessment
- Estimation of the overall food delivery market size based on national food service industry revenue and growth rates
- Segmentation of the market by cuisine type, delivery method, and consumer demographics to identify key growth areas
- Incorporation of trends in online ordering and delivery preferences influenced by the COVID-19 pandemic
Bottom-up Modeling
- Collection of data on order volumes and average transaction values from leading food delivery platforms operating in the UAE
- Analysis of operational costs and pricing strategies of food delivery services to determine profitability margins
- Estimation of market share for various players based on user base and transaction frequency
Forecasting & Scenario Analysis
- Development of predictive models using historical growth rates and consumer adoption trends to forecast future market size
- Scenario analysis based on potential regulatory changes, economic conditions, and shifts in consumer behavior
- Creation of multiple growth scenarios (baseline, optimistic, and pessimistic) to assess potential market trajectories through 2030
Phase 3: CATI Sample Composition1
| Scope Item/Segment | Sample Size | Target Respondent Profiles |
|---|---|---|
| Consumer Preferences for Food Delivery | 150 | Regular Users of Food Delivery Apps, Occasional Users |
| Restaurant Partnerships and Collaborations | 100 | Restaurant Owners, Managers, and Franchise Operators |
| Logistics and Delivery Operations | 80 | Logistics Managers, Delivery Coordinators |
| Market Trends and Innovations | 70 | Industry Analysts, Market Researchers |
| Consumer Satisfaction and Feedback | 120 | Frequent Users, First-time Users |
Frequently Asked Questions
What is the current value of the UAE Food Delivery Apps Market?
The UAE Food Delivery Apps Market is valued at approximately USD 1.5 billion, reflecting significant growth driven by smartphone adoption, e-commerce expansion, and changing consumer preferences for convenience, particularly during the pandemic.
Which cities dominate the UAE Food Delivery Apps Market?
What are the main types of food delivery services in the UAE?
Who are the primary end-users of food delivery apps in the UAE?
Other Regional/Country Reports
Indonesia Food Delivery Apps Market
Malaysia Food Delivery Apps Market
KSA Food Delivery Apps Market
APAC Food Delivery Apps Market
SEA Food Delivery Apps Market
Vietnam Food Delivery Apps Market
Other Adjacent Reports
Thailand Last-Mile Delivery Logistics Market
GCC Online Grocery Delivery Market Size, Share, Growth Drivers, Trends, Opportunities & Forecast 2025–2030Vietnam E-Commerce Platform Market
Mexico Mobile Payment Solutions Market
Indonesia Food Tech Innovation Market
Belgium Cloud Kitchen Operations Market
Singapore Meal Kit Subscription Market
Qatar Supply Chain Management Market Report Size Share Growth Drivers Trends Opportunities & Forecast 2025–2030Oman Customer Analytics Software Market
Why Buy From Us?

What makes us stand out is that our consultants follow Robust, Refine and Result (RRR) methodology. Robust for clear definitions, approaches and sanity checking, Refine for differentiating respondents' facts and opinions, and Result for presenting data with story.

We have set a benchmark in the industry by offering our clients with syndicated and customized market research reports featuring coverage of entire market as well as meticulous research and analyst insights.

While we don't replace traditional research, we flip the method upside down. Our dual approach of Top Bottom & Bottom Top ensures quality deliverable by not just verifying company fundamentals but also looking at the sector and macroeconomic factors.

With one step in the future, our research team constantly tries to show you the bigger picture. We help with some of the tough questions you may encounter along the way: How is the industry positioned? Best marketing channel? KPI's of competitors? By aligning every element, we help maximize success.

Our report gives you instant access to the answers and sources that other companies might choose to hide. We elaborate each steps of research methodology we have used and showcase you the sample size to earn your trust.

If you need any support, we are here! We pride ourselves on universe strength, data quality, and quick, friendly, and professional service.