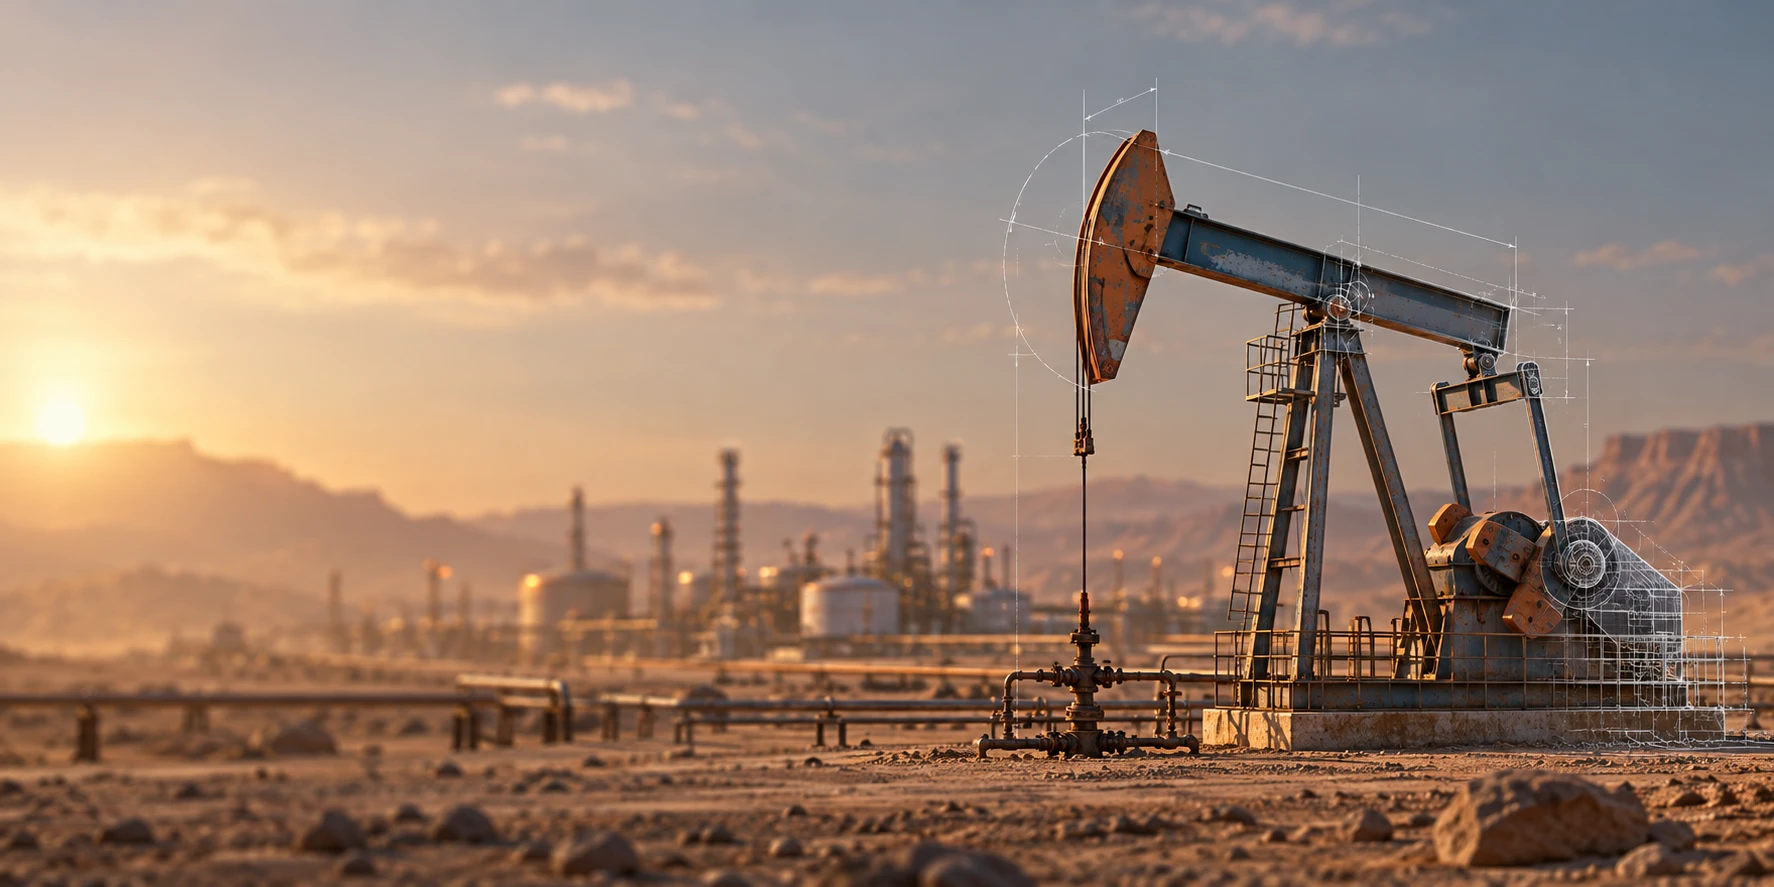
CHAPTER 1 - MARKET SUMMARY
Market Overview
The Egypt Oil and Gas Market is anchored by domestic power, transport and industrial fuel requirements, with hydrocarbons still dominating the national energy system. IMF analysis indicates natural gas represented about 58% of Egypt's energy mix and oil about 34%, underscoring the sector's direct linkage to electricity generation, mobility, fertilizers, refining and industrial output.
Operational activity is concentrated across the Mediterranean offshore, Nile Delta, Western Desert, Gulf of Suez and established processing corridors. In 2024, Egypt reported total hydrocarbon production of around 1.4 million barrels of oil equivalent per day, while new production added during July-September included about 30,000 barrels per day of oil and 133 million cubic feet per day of gas.
Market Value
USD 7,540 million
2025
Dominant Region
Mediterranean and Nile Delta Offshore Corridor
2025
Dominant Segment
Natural Gas
fastest growing, 2025-2032
Total Number of Players
48
Future Outlook
The Egypt Oil and Gas Market is projected to expand from USD 7,540 million in 2025 to approximately USD 11,934 million by 2032, implying a forecast CAGR of 6.78%. The recovery profile assumes increased upstream capital deployment, improved contractor payment conditions, development drilling across Mediterranean and Western Desert assets, and sustained demand for gas in power and industrial applications. The Ministry's five-year exploration program targets 484 exploration wells, while Eni, bp and Arcius have announced planned investment totaling approximately USD 16.7 billion over five years, improving the probability of reserve replacement and production stabilization.
Growth is expected to become increasingly gas-led, with infrastructure enabling Egypt to combine domestic production, imported LNG, Israeli pipeline gas and future Cypriot volumes. The government's longer-term objective calls for approximately 6 Bcf/d of gas and 1 million barrels per day of crude oil production by 2030, while regasification capacity has been expanded to around 2.7 Bcf/d. The historical 2020-2025 market CAGR of 5.06% was constrained by field decline and financing pressures; the forecast 6.78% CAGR incorporates a higher investment cycle, new discoveries, field optimization and greater utilization of regional processing and LNG infrastructure.
6.78%
Forecast CAGR
$11,934 Mn
2030 Projection
Base Year
2025
Historical Period
2020-2025
Forecast Period
2025-2032
Historical CAGR
5.06%
CHAPTER 2 - SCOPE OF REPORT
Scope of the Market
CHAPTER 3 - Key Stakeholders
Key Target Audience
Key stakeholders who can leverage from this market analysis for investment, strategy, and operational planning.
Investors
reserve replacement, capex, production growth, cash margins
Corporates
gas availability, procurement exposure, infrastructure, operating costs
Government
import substitution, production security, investment, fiscal returns
Operators
well productivity, recovery factor, uptime, drilling economics
Financial institutions
project finance, reserves, covenants, commodity exposure, liquidity
CHAPTER 4 - Market Size & Growth
Market Size, Growth Forecast and Trends
This section evaluates the historical market size, analyzes year-over-year growth dynamics, and presents forecast projections supported by market performance indicators and demand-side drivers.
Historical & Projected Market Size ($ Million)
Year-over-Year Growth Rate (%)
Market Value vs Volume Growth (%)
Historical Market Performance (2020-2025)
Historical performance reflected a combination of commodity-price normalization, upstream production maturity and domestic supply requirements. The strongest annual value expansion occurred in 2022 at 9.29%, while growth moderated to 1.98% in 2024 as natural gas production declined and imported supply requirements increased. The operating inflection began during late 2024 and 2025 as Egypt accelerated well interventions, introduced gas-production incentives, improved partner settlements and relaunched exploration opportunities through the Egypt Upstream Gateway. The five-year value CAGR reached 5.06%, despite weaker physical production during the later historical years.
Forecast Market Outlook (2025-2032)
The forecast incorporates higher capital intensity and a gradual recovery in domestic volumes rather than a simple commodity-price uplift. Market value is projected to reach USD 11,934 million by 2032, representing a 6.78% CAGR. Gas production recovery, deepwater drilling, Western Desert infill programs, imported LNG balancing and refinery efficiency investments are expected to support value creation. The Ministry's longer-term production plan targets about 6 Bcf/d of gas and 1 million barrels per day of crude oil by 2030, while new regional gas flows through Egyptian facilities could improve infrastructure utilization and fee-based revenue pools.
CHAPTER 5 - Market Data
Market Breakdown
The Egypt Oil and Gas Market is entering an investment-led recovery cycle in which gas supply security, crude-production stabilization and import-balancing infrastructure determine the pace of value growth. For CEOs and investors, the central question is how rapidly domestic production gains can offset imported energy costs while improving utilization of existing processing, pipeline, LNG and refining assets.
Year | Market Size (USD Mn) | YoY Growth (%) | Gas Production (Bcf/d) | Liquids Production (000 b/d) | LNG Import Requirement (Bcf/d) | Period |
|---|---|---|---|---|---|---|
| 2020 | $5,890 Mn | +- | 5.8 | 640 | Forecast | |
| 2021 | $6,240 Mn | +5.94% | 6.7 | 635 | Forecast | |
| 2022 | $6,820 Mn | +9.29% | 6.3 | 628 | Forecast | |
| 2023 | $7,070 Mn | +3.67% | 5.7 | 620 | Forecast | |
| 2024 | $7,210 Mn | +1.98% | 4.9 | 639 | Forecast | |
| 2025 | $7,540 Mn | +4.58% | 4.2 | 613 | Forecast | |
| 2026 | $8,051 Mn | +6.78% | 4.5 | 625 | Forecast | |
| 2027 | $8,597 Mn | +6.78% | 4.8 | 650 | Forecast | |
| 2028 | $9,180 Mn | +6.78% | 5.1 | 690 | Forecast | |
| 2029 | $9,802 Mn | +6.78% | 5.5 | 780 | Forecast | |
| 2030 | $10,467 Mn | +6.78% | 6.0 | 1,000 | Forecast | |
| 2031 | $11,177 Mn | +6.78% | 6.2 | 1,025 | Forecast | |
| 2032 | $11,934 Mn | +6.77% | 6.4 | 1,050 | Forecast |
Gas Production
4.2 Bcf/d, 2025, Egypt. Production recovery is the key determinant of LNG-import substitution and power-sector fuel security. bp's Raven second development phase is expected to access approximately 220 Bcf of gas plus 7 million barrels of condensate.
Liquids Production
approximately 613 thousand b/d, 2025, Egypt. Mature-field decline raises the value of rapid-cycle onshore development, enhanced recovery and brownfield drilling. The petroleum ministry's five-year plan targets doubling domestic crude production by 2030 through technology, horizontal drilling and new commercial models.
LNG Import Requirement
1.2 Bcf/d, 2025, Egypt. High import reliance raises the marginal value of domestic gas additions and storage-regasification flexibility. EIA data show LNG imports quadrupled from roughly 0.3 Bcf/d in 2024 to 1.2 Bcf/d in 2025.
CHAPTER 6 - Segmentation
Market Segmentation Framework
Comprehensive analysis across key dimensions providing insights into market structure, consumer preferences, and distribution patterns.
No of Segments
7
Dominant Segment
Value Chain Stage
Fastest Growing Segment
Energy Source
Energy Source
Application
End User
Project Scale
Ownership Model
Value Chain Stage
Geography
Key Segmentation Takeaways
Comprehensive analysis across all extracted segmentation dimensions providing insights into market structure, consumer preferences, and distribution patterns.
Value Chain Stage
Development and production represents the largest commercial pool because field operations concentrate capital expenditure, drilling, subsea systems, production services and state-contractor revenue. Midstream and gas processing are becoming strategically more valuable as Egypt uses pipelines, LNG facilities and regasification assets to balance domestic deficits and monetize Eastern Mediterranean gas flows.
Energy Source
Natural gas is expected to lead incremental growth because domestic electricity, fertilizer and industrial demand has exceeded locally available supply. New Mediterranean developments, Western Desert gas incentives and prospective Cypriot and Israeli flows strengthen the gas infrastructure opportunity. The fastest-growing commercial sub-segment is imported and domestically produced natural gas processed through Egypt's national network and LNG infrastructure.
CHAPTER 7 - Regional Analysis
Regional Analysis
Egypt occupies a mid-to-upper position among North African and Eastern Mediterranean oil and gas markets, combining a sizeable domestic demand base with more diversified midstream infrastructure than most peers. Its relative advantage is strongest in LNG processing, gas-network connectivity and transit infrastructure, while Algeria and Libya retain larger hydrocarbon production pools.
Focus Country Ranking
3rd
Focus Country Market Size
USD 7.54 Bn (2025)
Egypt CAGR (2025-2032)
6.78%
Focus Country Ranking
3rd
Focus Country Market Size
USD 7.54 Bn (2025)
Egypt CAGR (2025-2032)
6.78%
Regional Analysis (Current Year)
Regional Analysis Comparison
| Metric | Egypt | Algeria | Libya | Israel | Tunisia |
|---|---|---|---|---|---|
| Market Size | USD 7.54 Bn | USD 16.8 Bn | USD 11.2 Bn | USD 4.9 Bn | USD 1.8 Bn |
| CAGR (%) | 6.78% | 4.8% | 5.4% | 7.2% | 3.9% |
| Hydrocarbon Demand Proxy (million boe/year) | ~660 | ~780 | ~310 | ~220 | ~120 |
| Gas/Liquids Strategic Capacity Proxy | 2 LNG plants plus 2.7 Bcf/d regasification system | Large pipeline and LNG export system | Oil-export-led production infrastructure | Leviathan, Tamar and Karish gas hubs | Smaller domestic fields and import infrastructure |
Market Position
Egypt ranks third in the selected peer group at approximately USD 7.54 billion in 2025, supported by large domestic demand and uniquely diversified oil, gas, LNG and transit infrastructure.
Growth Advantage
Egypt's projected 6.78% CAGR places it above mature North African peers and near faster-growing Eastern Mediterranean gas markets, reflecting recovery investment and infrastructure monetization rather than production volume alone.
Competitive Strengths
Egypt combines two operating LNG export plants, expanding regasification capability and the 2.5 million b/d SUMED pipeline, giving the country multiple monetization routes unavailable to most regional peers.
CHAPTER 8 - INDUSTRY ANALYSIS
Growth Drivers, Challenges & Opportunities
Comprehensive analysis of key factors shaping the Egypt Oil and Gas Market, including growth catalysts, operational challenges, and emerging opportunities across production, distribution, and consumer segments.
Growth Drivers
Upstream Reinvestment and Exploration Acceleration
- The FY2024/25 agreements include 115 planned wells (FY2024/25, Egypt), supporting seismic, drilling, completion and production-service demand across onshore and offshore basins.
- The government's multi-year exploration program targets 484 exploration wells and roughly USD 5.2 billion of exploration investment (five-year plan, Egypt), creating a larger addressable opportunity for operators and oilfield-service providers.
- Eni, bp and Arcius plan approximately USD 16.7 billion of investment (next five years, Egypt), improving the capital pipeline for producing fields and infrastructure-linked developments.
Gas Security and Import Substitution
- Imports rose from about 0.3 Bcf/d in 2024 to 1.2 Bcf/d in 2025 (Egypt), widening the addressable value pool for field-development projects that displace expensive imported cargoes.
- bp's Raven development is expected to access approximately 220 Bcf of gas and 7 million barrels of condensate (project resource, Egypt), demonstrating the value of subsea tie-backs to existing infrastructure.
- Khalda Petroleum added more than 200 MMcf/d of gas in less than one year (2025, Western Desert), illustrating how commercial incentives and rapid-cycle onshore drilling can reduce imported LNG exposure.
Regional Gas Hub and Infrastructure Monetization
- Egypt remains the Eastern Mediterranean country with established LNG export capacity, enabling imported or regional gas to access international markets through existing liquefaction assets.
- Cyprus and Egypt signed frameworks to process future offshore Cypriot gas through Egyptian infrastructure, extending the economic life and utilization potential of existing LNG facilities.
- The SUMED system provides approximately 2.5 million b/d of crude pipeline capacity (current infrastructure, Egypt), reinforcing Egypt's strategic role in regional petroleum logistics.
Market Challenges
Natural Gas Production Decline and Import Exposure
- The import requirement expanded approximately fourfold from 0.3 Bcf/d in 2024 (Egypt), exposing the market to global LNG price volatility and cargo availability.
- Deepwater Mediterranean production requires larger capital commitments and longer development timelines than Western Desert wells, increasing execution risk when reserve replacement lags natural decline.
- Natural gas supplies a structurally large share of Egypt's energy system, historically around 58% of the energy mix (IMF assessment, Egypt), amplifying macroeconomic consequences from production shortfalls.
Mature Asset Decline and Capital Intensity
- Older fields require infill drilling, enhanced recovery, compression and workovers, raising sustaining capital per incremental barrel compared with new high-productivity discoveries.
- Historic partner arrears had exceeded USD 6 billion approximately two years before July 2026 (Egypt), demonstrating how payment conditions can directly affect operator investment and production maintenance.
- Production recovery increasingly depends on technology such as horizontal drilling and hydraulic fracturing, creating execution and subsurface risks alongside opportunities for specialized service providers.
Energy Transition and Domestic Gas Allocation
- Renewable penetration can reduce gas burn in power generation, shifting hydrocarbon demand toward fertilizers, petrochemicals and export-oriented value-added industries.
- The petroleum sector has implemented 117 renewable-energy projects at operating sites (2025, Egypt), increasing expectations for lower-carbon field operations and energy-efficiency investment.
- Efficiency measures reportedly reduced sector energy use by approximately 8% and avoided around 1.4 million tonnes of carbon emissions (2025, Egypt), raising the performance threshold for new projects.
Market Opportunities
Brownfield Production Recovery
- Service companies can monetize workovers, artificial lift, reservoir surveillance, horizontal drilling and stimulation as operators prioritize short-cycle barrels with faster cash recovery.
- Operators, drilling contractors and equipment suppliers benefit where incremental onshore production can be connected quickly to established processing infrastructure without major greenfield capex.
- Continued commercial reform, reliable partner payments and flexible production-sharing economics remain necessary to sustain the investment rate required for mature-field recovery.
Eastern Mediterranean Gas Processing Hub
- Fee-based processing, pipeline transport, liquefaction and regasification provide potential revenue pools without requiring Egypt to own all underlying gas reserves.
- Infrastructure owners, LNG partners, pipeline operators and industrial gas buyers benefit as Cypriot and Israeli molecules increase utilization of Egypt's existing assets.
- Additional cross-border agreements, predictable processing tariffs and reliable domestic allocation rules are required to convert regional discoveries into recurring Egyptian infrastructure revenue.
Deepwater and Frontier Exploration
- Large discoveries can generate long-duration revenue across seismic, drilling, subsea engineering, production systems and gas-processing infrastructure, creating multiple profit pools around a single successful field.
- International operators and specialist service suppliers benefit from Egypt's established concessions, nearby infrastructure and proven deepwater petroleum systems.
- More flexible fiscal terms, faster development approvals and continued digital subsurface-data access are required to convert frontier acreage into commercially sanctioned projects.
CHAPTER 9 - Competitive Landscape
Competitive Landscape Overview
Competition combines state-linked concession structures with international majors, large independent producers and domestic specialists. Entry barriers remain high because material participation requires exploration rights, capital, subsurface expertise, safety systems and integration with state-controlled infrastructure.
Market Share Distribution
Top 5 Players
Market Dynamics
8 new entrants in the past 5 years, indicating strong market attractiveness and growth potential.
Company Name | Market Share | Headquarters | Founding Year | Core Market Focus |
|---|---|---|---|---|
Eni S.p.A. | - | Rome, Italy | 1953 | Zohr, Nile Delta and Western Desert exploration, production, LNG and refining exposure |
bp p.l.c. | - | London, United Kingdom | 1909 | West Nile Delta and Mediterranean natural gas development and production |
APA Corporation / Apache | - | Houston, United States | 1954 | Western Desert oil and gas exploration, development and production |
Shell plc | - | London, United Kingdom | 1907 | Mediterranean gas exploration, WDDM infrastructure and LNG participation |
Cheiron Petroleum Corporation | - | Cairo, Egypt | - | Egyptian onshore and offshore exploration and production |
Dragon Oil | - | Dubai, United Arab Emirates | 1971 | Gulf of Suez oil production through GUPCO and exploration |
Harbour Energy plc | - | London, United Kingdom | 2014 | West Nile Delta and Greater Disouq gas and condensate production |
Exxon Mobil Corporation | - | Spring, Texas, United States | 1999 | Deepwater Mediterranean exploration and appraisal |
Chevron Corporation | - | Houston, Texas, United States | 1879 | Eastern Mediterranean and Egyptian offshore gas exploration |
QatarEnergy | - | Doha, Qatar | 1974 | Offshore exploration interests and Eastern Mediterranean gas participation |
Cross Comparison Parameters
The report provides detailed cross-comparison of key players across 10 performance parameters to identify competitive strengths and weaknesses.
Egypt Production Volume
Reserve Replacement and Well Delivery
Egypt Upstream Capital Expenditure
Operating Cost per BOE
Analysis Covered
Market Share Analysis:
Compares operator scale using Egypt-specific production and asset exposure metrics.
Cross Comparison Matrix:
Benchmarks capital deployment, production efficiency, reserves and operating economics consistently.
SWOT Analysis:
Assesses portfolio resilience, execution capability, infrastructure access and geological exposure.
Pricing Strategy Analysis:
Evaluates fiscal terms, gas incentives and cost recovery economics comparatively.
Company Profiles:
Maps ownership, operating assets, project pipelines and strategic positioning comprehensively.
CHAPTER 10 - REPORT TOC
Table of Contents
Market Assessment Phase
Supply-side and competitive intelligence covering market sizing, segmentation, competitive dynamics, regulatory landscape, and future forecasts.
Go-To-Market Strategy Phase
15 chapters
Entry strategy evaluation, execution roadmap, partner recommendations, and profitability outlook.
Survey Phase
8 chapters
Demand-side primary research conducted through structured interviews and online surveys with end users across priority metros and Tier 2/3 cities to capture consumption behavior, unmet needs, and purchase drivers.
Complete Report Coverage
201+ detailed sections covering every aspect of the market
143
Assessment Sections
58
Strategy Sections
CHAPTER 11 - Our Approach
Research Methodology
Desk Research
- Mapped Egyptian concession and operator activity
- Reviewed petroleum agreements and investment programs
- Tracked production, imports and LNG infrastructure
- Benchmarked refinery and pipeline operating indicators
Primary Research
- Interviewed upstream asset and reservoir managers
- Engaged drilling and production operations executives
- Consulted gas processing commercial managers
- Interviewed refinery and distribution procurement leaders
Validation and Triangulation
- Validated assumptions across 286 industry respondents
- Reconciled operator volumes with infrastructure throughput
- Cross-checked demand against supply balances
- Stress-tested pricing and utilization assumptions
CHAPTER 12 - FAQ
FAQs
Still have questions?
Our research team is here to help you find the right solution
CHAPTER 13 - Related Research
Explore Related Reports
Expand your market intelligence with complementary research across regions and adjacent markets.
Regional/Country ReportsRelated market analysis across key regions
Related market analysis across key regions
- Indonesia Oil and Gas Market Size, Share & Forecast, By Energy Source, Value Chain Stage & Geography, 2026-2032
- Vietnam Oil and Gas Market Size, Share & Forecast, By Energy Source, Value Chain Stage & Geography, 2026-2032
- Thailand Oil and Gas Market Size, Share & Forecast, By Energy Source, Value Chain Stage & Geography, 2026-2032
- Malaysia Oil and Gas Market Size, Share & Forecast, By Energy Source, Value Chain Stage & Geography, 2026-2032
- Philippines Oil and Gas Market Size, Share & Forecast, By Energy Source, Value Chain Stage & Geography, 2026-2032
Adjacent ReportsRelated markets and complementary research
Related markets and complementary research
- Vietnam Natural Gas Distribution Market
- South Korea LNG Storage and Regasification Market
- Brazil Petroleum Refining Equipment Market
- South Korea Oil and Gas Infrastructure Market
- Oman Energy Trading Market
500+
Market Research Reports
50+
Countries Covered
15+
Industry Verticals