About the Report
Base Year 2024Nigeria Furniture and Interior Design Market Overview
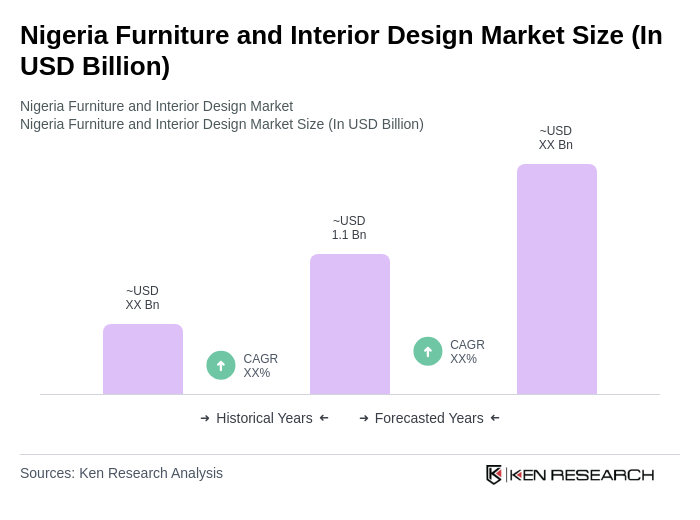
- The Nigeria Furniture and Interior Design Market is valued at USD 1.1 billion, based on a five-year historical analysis. Growth is primarily driven by increasing urbanization, rising disposable incomes, and a growing middle class seeking modern and stylish furniture solutions. Demand for both residential and commercial furniture has surged, reflecting a shift towards more sophisticated interior design preferences among consumers .
- Key cities such as Lagos, Abuja, and Port Harcourt dominate the market due to their large populations and economic activities. Lagos, as the commercial hub, has a high concentration of furniture retailers and interior design firms, while Abuja serves as the political center, attracting affluent consumers. Port Harcourt, supported by its oil industry, also contributes significantly to the demand for luxury and custom furniture .
- The Nigerian government has implemented policies such as the Made in Nigeria campaign and import restrictions to promote local furniture production and reduce reliance on imports. These initiatives, including tax incentives and subsidies, encourage manufacturers to source materials locally and adhere to quality standards, enhancing the competitiveness of the domestic furniture industry (e.g., “Import Prohibition List (Trade), 2022 issued by the Federal Ministry of Finance, Budget and National Planning,” which restricts the importation of certain furniture products and supports local manufacturing) .
Nigeria Furniture and Interior Design Market Segmentation
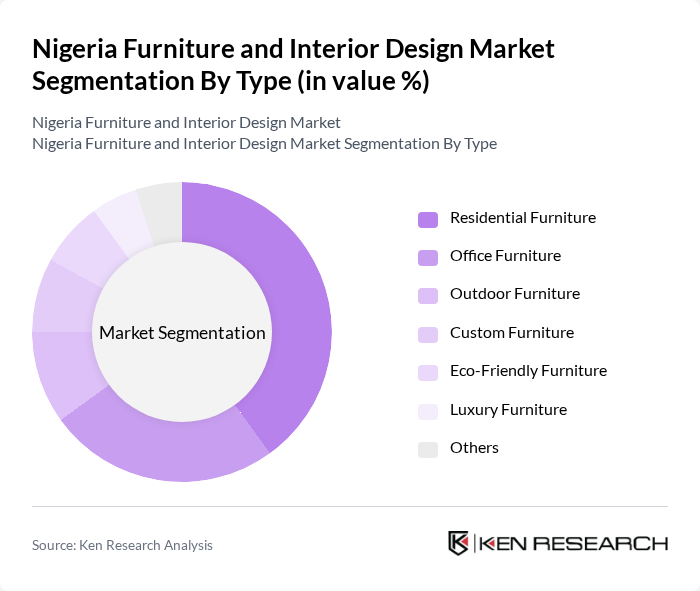
By Type:The furniture market is segmented into various types, including residential furniture, office furniture, outdoor furniture, custom furniture, eco-friendly furniture, luxury furniture, and others. Among these, residential furniture is the most dominant segment, driven by the increasing demand for home furnishings as urbanization continues to rise. Consumers are investing in stylish and functional furniture that enhances their living spaces. The market is also witnessing a rising preference for wooden and eco-friendly furniture, reflecting sustainability trends and the appeal of traditional aesthetics .
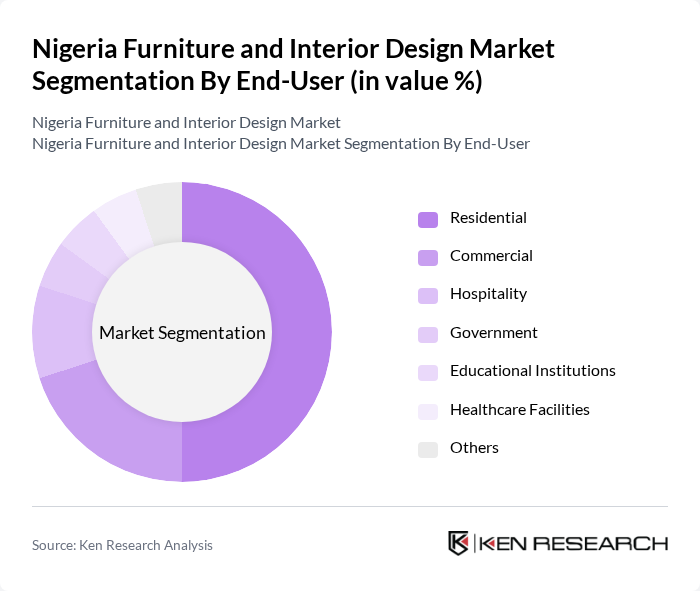
By End-User:The end-user segmentation includes residential, commercial, hospitality, government, educational institutions, healthcare facilities, and others. The residential segment leads the market, fueled by the growing trend of home renovations and the desire for personalized living spaces. Consumers are increasingly opting for furniture that reflects their style and meets their functional needs. The commercial and hospitality segments are also expanding, supported by new office developments and hotel projects in major urban centers .
Nigeria Furniture and Interior Design Market Competitive Landscape
The Nigeria Furniture and Interior Design Market is characterized by a dynamic mix of regional and international players. Leading participants such as IKEA Nigeria, Mabeo Furniture, Tusk Furniture, Tantalizers Furniture, Aso Rock Furniture, Dufil Prima Foods, A & A Furniture, Ajao Estate Furniture, Ayo Furniture, Duro Furniture, Eko Furniture, Fadeyi Furniture, Glo Furniture, H & H Furniture, Iroko Furniture, Office Furniture Nigeria, Tetra Furniture, Green Furniture, Konga Furniture, Jumia Furniture, Royal Furniture, Zenith Furniture, FURNITURE 360, Dura Furniture contribute to innovation, geographic expansion, and service delivery in this space .
Nigeria Furniture and Interior Design Market Industry Analysis
Growth Drivers
- Increasing Urbanization:Nigeria's urban population is projected to reach 220 million in future, up from 200 million in future, according to the World Bank. This rapid urbanization drives demand for residential and commercial furniture as new housing developments emerge. Urban areas are expected to see a 30% increase in housing projects, necessitating modern interior design solutions. Consequently, furniture manufacturers are poised to benefit from this growing market segment, catering to the evolving tastes of urban dwellers.
- Rising Disposable Income:The average disposable income in Nigeria is expected to rise to approximately $2,100 per capita in future, up from $2,500 in future, as reported by the IMF. This increase in disposable income allows consumers to invest more in home furnishings and interior design. As a result, the demand for high-quality, stylish furniture is anticipated to grow, with consumers seeking products that reflect their personal style and enhance their living spaces.
- Growing Real Estate Sector:The Nigerian real estate sector is projected to grow by 5% to 7% annually, driven by increased investments in residential and commercial properties. In future, the sector's value is expected to reach $15 billion, according to industry reports. This growth creates a robust demand for furniture and interior design services, as new developments require comprehensive furnishing solutions. Consequently, furniture manufacturers and designers are well-positioned to capitalize on this expanding market opportunity.
Market Challenges
- High Import Tariffs:Nigeria imposes import tariffs on furniture that can reach up to 35%, significantly increasing the cost of foreign-made products. This high tariff structure discourages international brands from entering the market and limits local consumers' access to diverse furniture options. As a result, local manufacturers face challenges in competing with imported goods, which can lead to higher prices and reduced market competitiveness for domestic products.
- Limited Access to Financing:Access to financing remains a significant barrier for many furniture manufacturers in Nigeria, with only 20% of small and medium enterprises (SMEs) able to secure loans from banks, according to the Central Bank of Nigeria. This limited access hampers the ability of businesses to invest in production capacity and innovation. Consequently, many manufacturers struggle to meet growing consumer demand, stifling potential growth in the furniture and interior design market.
Nigeria Furniture and Interior Design Market Future Outlook
As Nigeria's economy continues to evolve, the furniture and interior design market is expected to experience significant transformations. The increasing focus on sustainability and eco-friendly materials will drive innovation in product offerings. Additionally, the rise of e-commerce platforms will facilitate greater access to furniture products, allowing consumers to explore diverse options from the comfort of their homes. These trends indicate a dynamic market landscape, with opportunities for growth and adaptation in response to changing consumer preferences and technological advancements.
Market Opportunities
- E-commerce Growth:The e-commerce sector in Nigeria is projected to reach $13 billion in future, creating a significant opportunity for furniture retailers to expand their online presence. This growth allows businesses to reach a broader audience, catering to the increasing demand for convenient shopping experiences. By leveraging digital platforms, furniture companies can enhance their visibility and sales potential in a competitive market.
- Customization Trends:There is a growing consumer preference for customized furniture solutions, with 60% of buyers expressing interest in personalized designs, according to industry surveys. This trend presents an opportunity for manufacturers to differentiate themselves by offering bespoke products that cater to individual tastes and preferences. By embracing customization, companies can enhance customer satisfaction and loyalty, driving long-term growth in the market.
Scope of the Report
| Segment | Sub-Segments |
|---|---|
| By Type | Residential Furniture Office Furniture Outdoor Furniture Custom Furniture Eco-Friendly Furniture Luxury Furniture Others |
| By End-User | Residential Commercial Hospitality Government Educational Institutions Healthcare Facilities Others |
| By Distribution Channel | Online Retail Brick-and-Mortar Stores Wholesale Distributors Direct Sales Trade Shows Others |
| By Material | Wood Metal Plastic Fabric Glass Others |
| By Price Range | Budget Mid-Range Premium Luxury Others |
| By Design Style | Contemporary Traditional Industrial Scandinavian Rustic Others |
| By Functionality | Multi-Functional Furniture Space-Saving Furniture Ergonomic Furniture Modular Furniture Others |
Key Target Audience
Investors and Venture Capitalist Firms
Government and Regulatory Bodies (e.g., National Bureau of Statistics, Federal Ministry of Industry, Trade and Investment)
Manufacturers and Producers
Distributors and Retailers
Interior Design Firms
Real Estate Developers
Construction Companies
Financial Institutions
Players Mentioned in the Report:
IKEA Nigeria
Mabeo Furniture
Tusk Furniture
Tantalizers Furniture
Aso Rock Furniture
Dufil Prima Foods
A & A Furniture
Ajao Estate Furniture
Ayo Furniture
Duro Furniture
Eko Furniture
Fadeyi Furniture
Glo Furniture
H & H Furniture
Iroko Furniture
Office Furniture Nigeria
Tetra Furniture
Green Furniture
Konga Furniture
Jumia Furniture
Royal Furniture
Zenith Furniture
FURNITURE 360
Dura Furniture
Table of Contents
Market Assessment Phase
1. Executive Summary and Approach
2. Nigeria Furniture and Interior Design Market Overview
2.1 Key Insights and Strategic Recommendations
2.2 Nigeria Furniture and Interior Design Market Overview
2.3 Definition and Scope
2.4 Evolution of Market Ecosystem
2.5 Timeline of Key Regulatory Milestones
2.6 Value Chain & Stakeholder Mapping
2.7 Business Cycle Analysis
2.8 Policy & Incentive Landscape
3. Nigeria Furniture and Interior Design Market Analysis
3.1 Growth Drivers
3.1.1 Increasing Urbanization
3.1.2 Rising Disposable Income
3.1.3 Growing Real Estate Sector
3.1.4 Demand for Sustainable Furniture
3.2 Market Challenges
3.2.1 High Import Tariffs
3.2.2 Limited Access to Financing
3.2.3 Inconsistent Quality Standards
3.2.4 Infrastructure Deficiencies
3.3 Market Opportunities
3.3.1 E-commerce Growth
3.3.2 Customization Trends
3.3.3 Export Potential
3.3.4 Government Initiatives for Local Manufacturing
3.4 Market Trends
3.4.1 Shift Towards Minimalist Designs
3.4.2 Increased Use of Technology in Design
3.4.3 Focus on Eco-Friendly Materials
3.4.4 Rise of Online Interior Design Services
3.5 Government Regulation
3.5.1 Furniture Quality Standards
3.5.2 Import Regulations
3.5.3 Tax Incentives for Local Manufacturers
3.5.4 Environmental Regulations
4. SWOT Analysis
5. Stakeholder Analysis
6. Porter's Five Forces Analysis
7. Nigeria Furniture and Interior Design Market Market Size, 2019-2024
7.1 By Value
7.2 By Volume
7.3 By Average Selling Price
8. Nigeria Furniture and Interior Design Market Segmentation
8.1 By Type
8.1.1 Residential Furniture
8.1.2 Office Furniture
8.1.3 Outdoor Furniture
8.1.4 Custom Furniture
8.1.5 Eco-Friendly Furniture
8.1.6 Luxury Furniture
8.1.7 Others
8.2 By End-User
8.2.1 Residential
8.2.2 Commercial
8.2.3 Hospitality
8.2.4 Government
8.2.5 Educational Institutions
8.2.6 Healthcare Facilities
8.2.7 Others
8.3 By Distribution Channel
8.3.1 Online Retail
8.3.2 Brick-and-Mortar Stores
8.3.3 Wholesale Distributors
8.3.4 Direct Sales
8.3.5 Trade Shows
8.3.6 Others
8.4 By Material
8.4.1 Wood
8.4.2 Metal
8.4.3 Plastic
8.4.4 Fabric
8.4.5 Glass
8.4.6 Others
8.5 By Price Range
8.5.1 Budget
8.5.2 Mid-Range
8.5.3 Premium
8.5.4 Luxury
8.5.5 Others
8.6 By Design Style
8.6.1 Contemporary
8.6.2 Traditional
8.6.3 Industrial
8.6.4 Scandinavian
8.6.5 Rustic
8.6.6 Others
8.7 By Functionality
8.7.1 Multi-Functional Furniture
8.7.2 Space-Saving Furniture
8.7.3 Ergonomic Furniture
8.7.4 Modular Furniture
8.7.5 Others
9. Nigeria Furniture and Interior Design Market Competitive Analysis
9.1 Market Share of Key Players
9.2 Cross Comparison of Key Players
9.2.1 Company Name
9.2.2 Group Size (Large, Medium, or Small as per industry convention)
9.2.3 Revenue Growth Rate (YoY, %)
9.2.4 Market Penetration Rate (% of target market served)
9.2.5 Customer Retention Rate (%)
9.2.6 Pricing Strategy (Premium, Mid-Range, Budget, Value-for-Money)
9.2.7 Product Diversification (Number of product categories, % of revenue from new launches)
9.2.8 Brand Recognition (Brand awareness score, social media following)
9.2.9 Distribution Network Efficiency (Number of outlets, online presence, delivery coverage)
9.2.10 Customer Satisfaction Score (Net Promoter Score, post-purchase ratings)
9.3 SWOT Analysis of Top Players
9.4 Pricing Analysis
9.5 Detailed Profile of Major Companies
9.5.1 IKEA Nigeria
9.5.2 Mabeo Furniture
9.5.3 Tusk Furniture
9.5.4 Tantalizers Furniture
9.5.5 Aso Rock Furniture
9.5.6 Dufil Prima Foods
9.5.7 A & A Furniture
9.5.8 Ajao Estate Furniture
9.5.9 Ayo Furniture
9.5.10 Duro Furniture
9.5.11 Eko Furniture
9.5.12 Fadeyi Furniture
9.5.13 Glo Furniture
9.5.14 H & H Furniture
9.5.15 Iroko Furniture
9.5.16 Office Furniture Nigeria
9.5.17 Tetra Furniture
9.5.18 Green Furniture
9.5.19 Konga Furniture
9.5.20 Jumia Furniture
9.5.21 Royal Furniture
9.5.22 Zenith Furniture
9.5.23 FURNITURE 360
9.5.24 Dura Furniture
10. Nigeria Furniture and Interior Design Market End-User Analysis
10.1 Procurement Behavior of Key Ministries
10.1.1 Budget Allocation Trends
10.1.2 Preferred Suppliers
10.1.3 Procurement Processes
10.1.4 Contracting Practices
10.2 Corporate Spend on Infrastructure & Energy
10.2.1 Investment Trends
10.2.2 Budget Priorities
10.2.3 Spending Patterns
10.3 Pain Point Analysis by End-User Category
10.3.1 Quality Concerns
10.3.2 Delivery Timeliness
10.3.3 After-Sales Support
10.4 User Readiness for Adoption
10.4.1 Awareness Levels
10.4.2 Training Needs
10.4.3 Technology Adoption
10.5 Post-Deployment ROI and Use Case Expansion
10.5.1 Performance Metrics
10.5.2 User Feedback
10.5.3 Future Investment Plans
11. Nigeria Furniture and Interior Design Market Future Size, 2025-2030
11.1 By Value
11.2 By Volume
11.3 By Average Selling Price
Go-To-Market Strategy Phase
1. Whitespace Analysis + Business Model Canvas
1.1 Market Gaps Identification
1.2 Value Proposition Development
1.3 Revenue Streams
1.4 Cost Structure Analysis
1.5 Key Partnerships
1.6 Customer Segments
1.7 Channels
2. Marketing and Positioning Recommendations
2.1 Branding Strategies
2.2 Product USPs
2.3 Target Audience Identification
2.4 Marketing Channels
2.5 Promotional Strategies
3. Distribution Plan
3.1 Urban Retail Strategies
3.2 Rural NGO Tie-Ups
3.3 Logistics and Supply Chain
3.4 Distribution Partnerships
4. Channel & Pricing Gaps
4.1 Underserved Routes
4.2 Pricing Bands
4.3 Competitive Pricing Analysis
5. Unmet Demand & Latent Needs
5.1 Category Gaps
5.2 Consumer Segments
5.3 Emerging Trends
6. Customer Relationship
6.1 Loyalty Programs
6.2 After-Sales Service
6.3 Customer Engagement Strategies
7. Value Proposition
7.1 Sustainability Initiatives
7.2 Integrated Supply Chains
7.3 Unique Selling Points
8. Key Activities
8.1 Regulatory Compliance
8.2 Branding Initiatives
8.3 Distribution Setup
9. Entry Strategy Evaluation
9.1 Domestic Market Entry Strategy
9.1.1 Product Mix
9.1.2 Pricing Band
9.1.3 Packaging
9.2 Export Entry Strategy
9.2.1 Target Countries
9.2.2 Compliance Roadmap
10. Entry Mode Assessment
10.1 Joint Ventures
10.2 Greenfield Investments
10.3 Mergers & Acquisitions
10.4 Distributor Model
11. Capital and Timeline Estimation
11.1 Capital Requirements
11.2 Timelines
12. Control vs Risk Trade-Off
12.1 Ownership vs Partnerships
13. Profitability Outlook
13.1 Breakeven Analysis
13.2 Long-Term Sustainability
14. Potential Partner List
14.1 Distributors
14.2 Joint Ventures
14.3 Acquisition Targets
15. Execution Roadmap
15.1 Phased Plan for Market Entry
15.1.1 Market Setup
15.1.2 Market Entry
15.1.3 Growth Acceleration
15.1.4 Scale & Stabilize
15.2 Key Activities and Milestones
15.2.1 Milestone Planning
15.2.2 Activity Tracking
Research Methodology
Phase 1: Approach1
Desk Research
- Analysis of industry reports from local and international market research firms
- Review of government publications and statistics on the furniture and interior design sector
- Examination of trade journals and online platforms focused on interior design trends in Nigeria
Primary Research
- Interviews with key stakeholders including furniture manufacturers and interior designers
- Surveys targeting consumers to understand preferences and purchasing behavior
- Focus group discussions with design professionals to gather insights on market trends
Validation & Triangulation
- Cross-validation of findings through multiple data sources including trade associations
- Triangulation of consumer insights with industry expert opinions
- Sanity checks through feedback from a panel of industry experts and practitioners
Phase 2: Market Size Estimation1
Top-down Assessment
- Estimation of market size based on national economic indicators and construction spending
- Segmentation of the market by product categories such as residential and commercial furniture
- Incorporation of growth rates from related sectors such as real estate and hospitality
Bottom-up Modeling
- Collection of sales data from leading furniture retailers and manufacturers
- Estimation of average transaction values and volume of sales across different segments
- Analysis of distribution channels and their impact on overall market performance
Forecasting & Scenario Analysis
- Development of forecasts based on historical growth trends and economic indicators
- Scenario analysis considering factors such as urbanization rates and consumer spending patterns
- Creation of best-case, worst-case, and most-likely scenarios through 2030
Phase 3: CATI Sample Composition1
| Scope Item/Segment | Sample Size | Target Respondent Profiles |
|---|---|---|
| Residential Furniture Purchases | 120 | Homeowners, Interior Design Enthusiasts |
| Commercial Interior Design Projects | 90 | Business Owners, Facility Managers |
| Online Furniture Retail Trends | 60 | E-commerce Managers, Digital Marketing Specialists |
| Custom Furniture Solutions | 50 | Interior Designers, Architects |
| Furniture Export Market Insights | 40 | Export Managers, Trade Analysts |
Frequently Asked Questions
What is the current value of the Nigeria Furniture and Interior Design Market?
The Nigeria Furniture and Interior Design Market is valued at approximately USD 1.1 billion, driven by urbanization, rising disposable incomes, and a growing middle class seeking modern furniture solutions.
Which cities are the main hubs for the furniture market in Nigeria?
What are the key growth drivers for the Nigeria Furniture Market?
What challenges does the Nigeria Furniture Market face?
Other Adjacent Reports
Brazil E-commerce Retail Market
Oman Sustainable Materials Market
Qatar Hospitality Furniture Market
North America Office Furniture Market Outlook to 2030: Size, Share, Growth and TrendsWhy Buy From Us?

What makes us stand out is that our consultants follow Robust, Refine and Result (RRR) methodology. Robust for clear definitions, approaches and sanity checking, Refine for differentiating respondents' facts and opinions, and Result for presenting data with story.

We have set a benchmark in the industry by offering our clients with syndicated and customized market research reports featuring coverage of entire market as well as meticulous research and analyst insights.

While we don't replace traditional research, we flip the method upside down. Our dual approach of Top Bottom & Bottom Top ensures quality deliverable by not just verifying company fundamentals but also looking at the sector and macroeconomic factors.

With one step in the future, our research team constantly tries to show you the bigger picture. We help with some of the tough questions you may encounter along the way: How is the industry positioned? Best marketing channel? KPI's of competitors? By aligning every element, we help maximize success.

Our report gives you instant access to the answers and sources that other companies might choose to hide. We elaborate each steps of research methodology we have used and showcase you the sample size to earn your trust.

If you need any support, we are here! We pride ourselves on universe strength, data quality, and quick, friendly, and professional service.